Tampa Bay Weather
The Mottafied Adventures 48hr BridgeBrief (Experimental)
Watches/Warnings
Loading active alerts map…
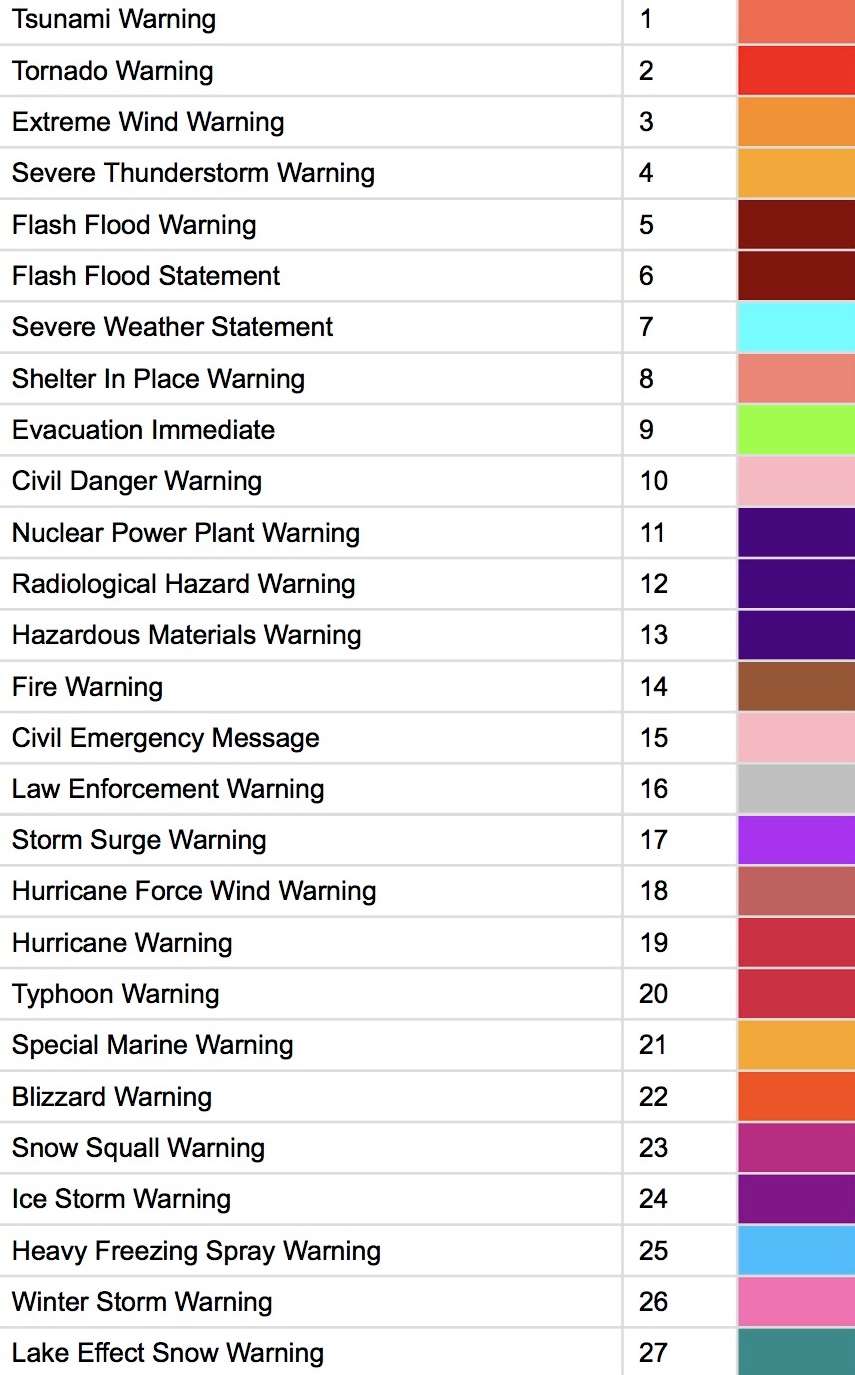
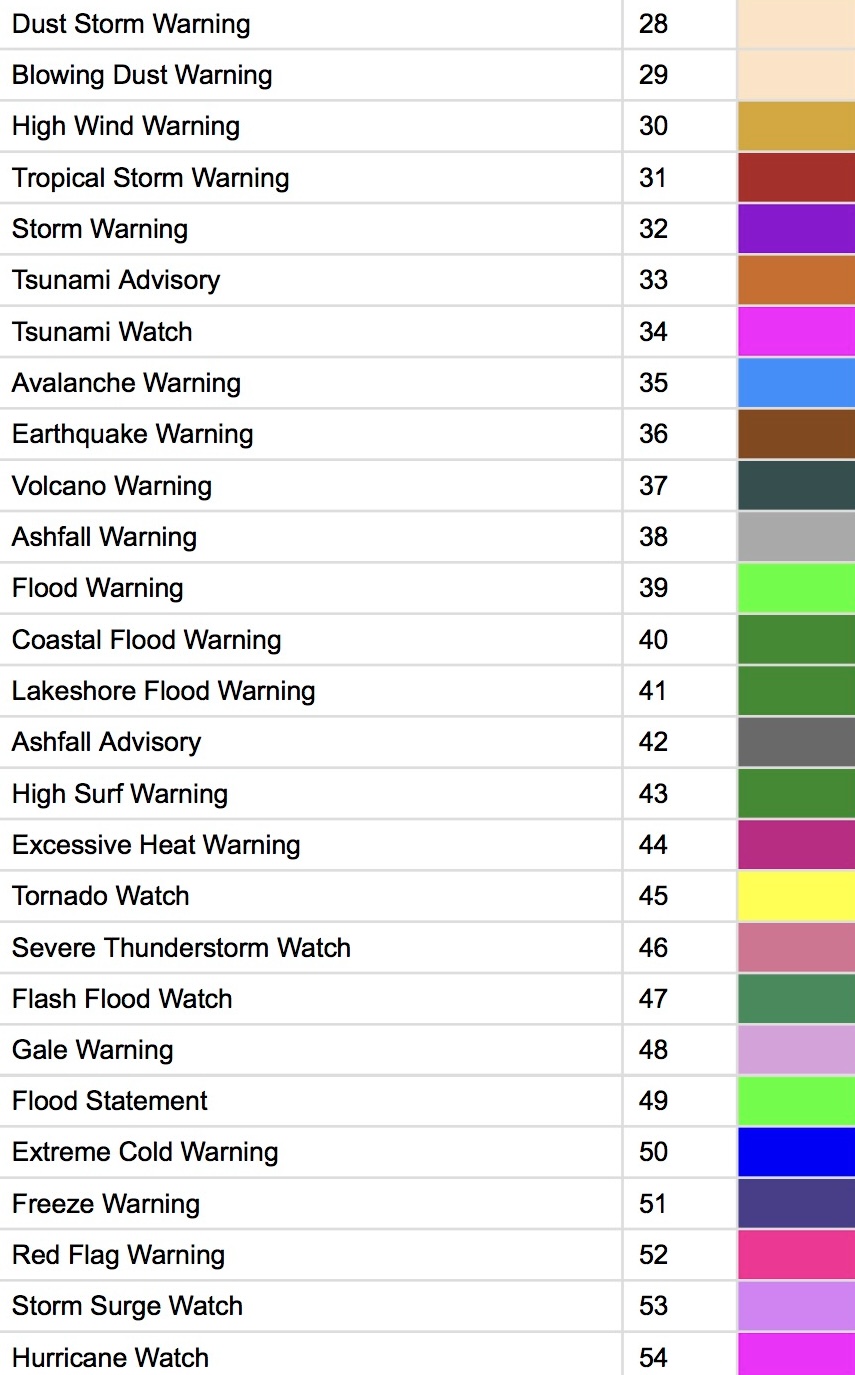
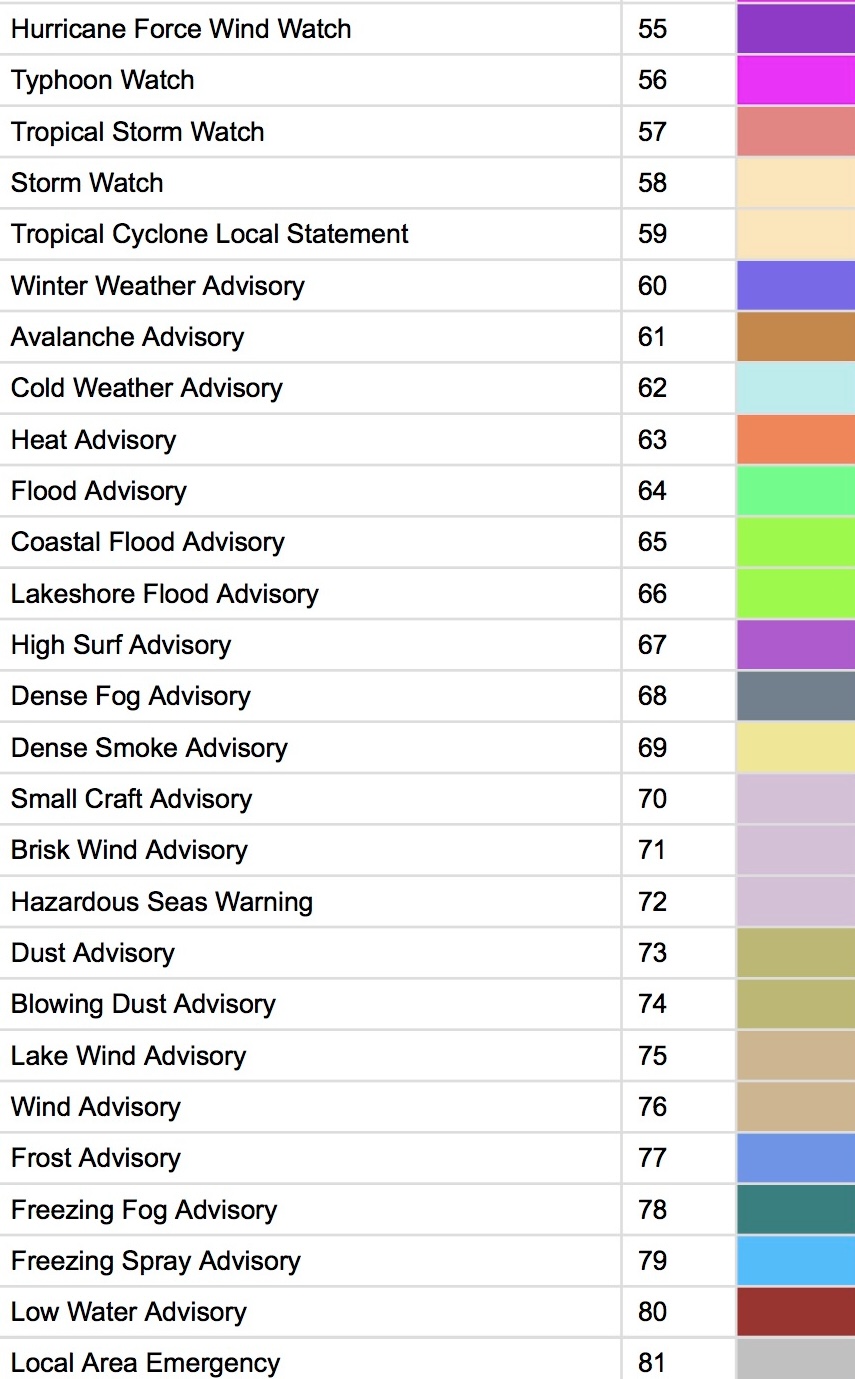
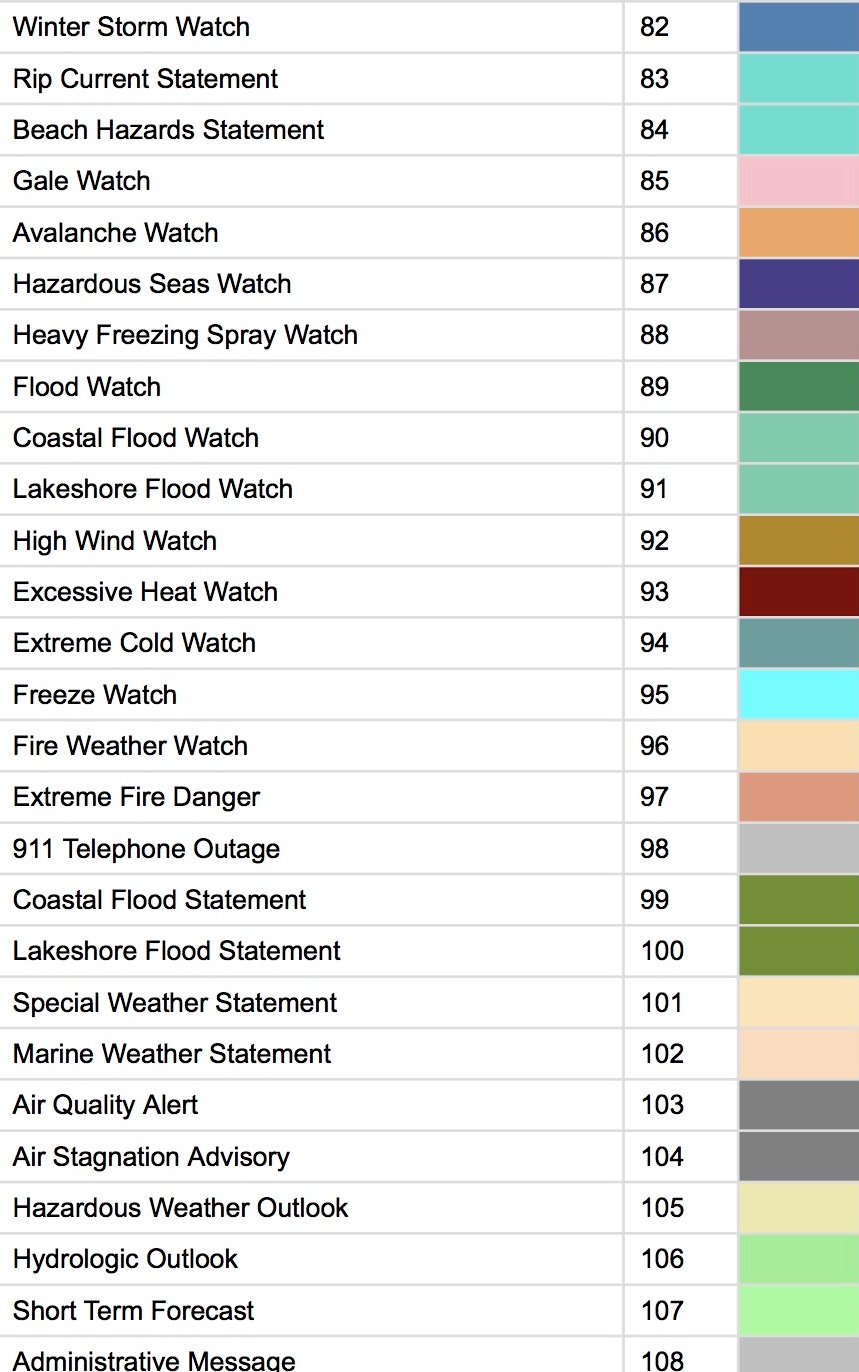
Current Watches, Warnings, and Alerts
Alert list is based on the visible map area. Loading the initial view…
Loading active alerts visible on the map…
Current 500 mb Chart
Current Surface Analysis
WPC Surface Analysis
WPC Surface Analysis and Satellite Composite
OPC Western Atlantic Surface Analysis
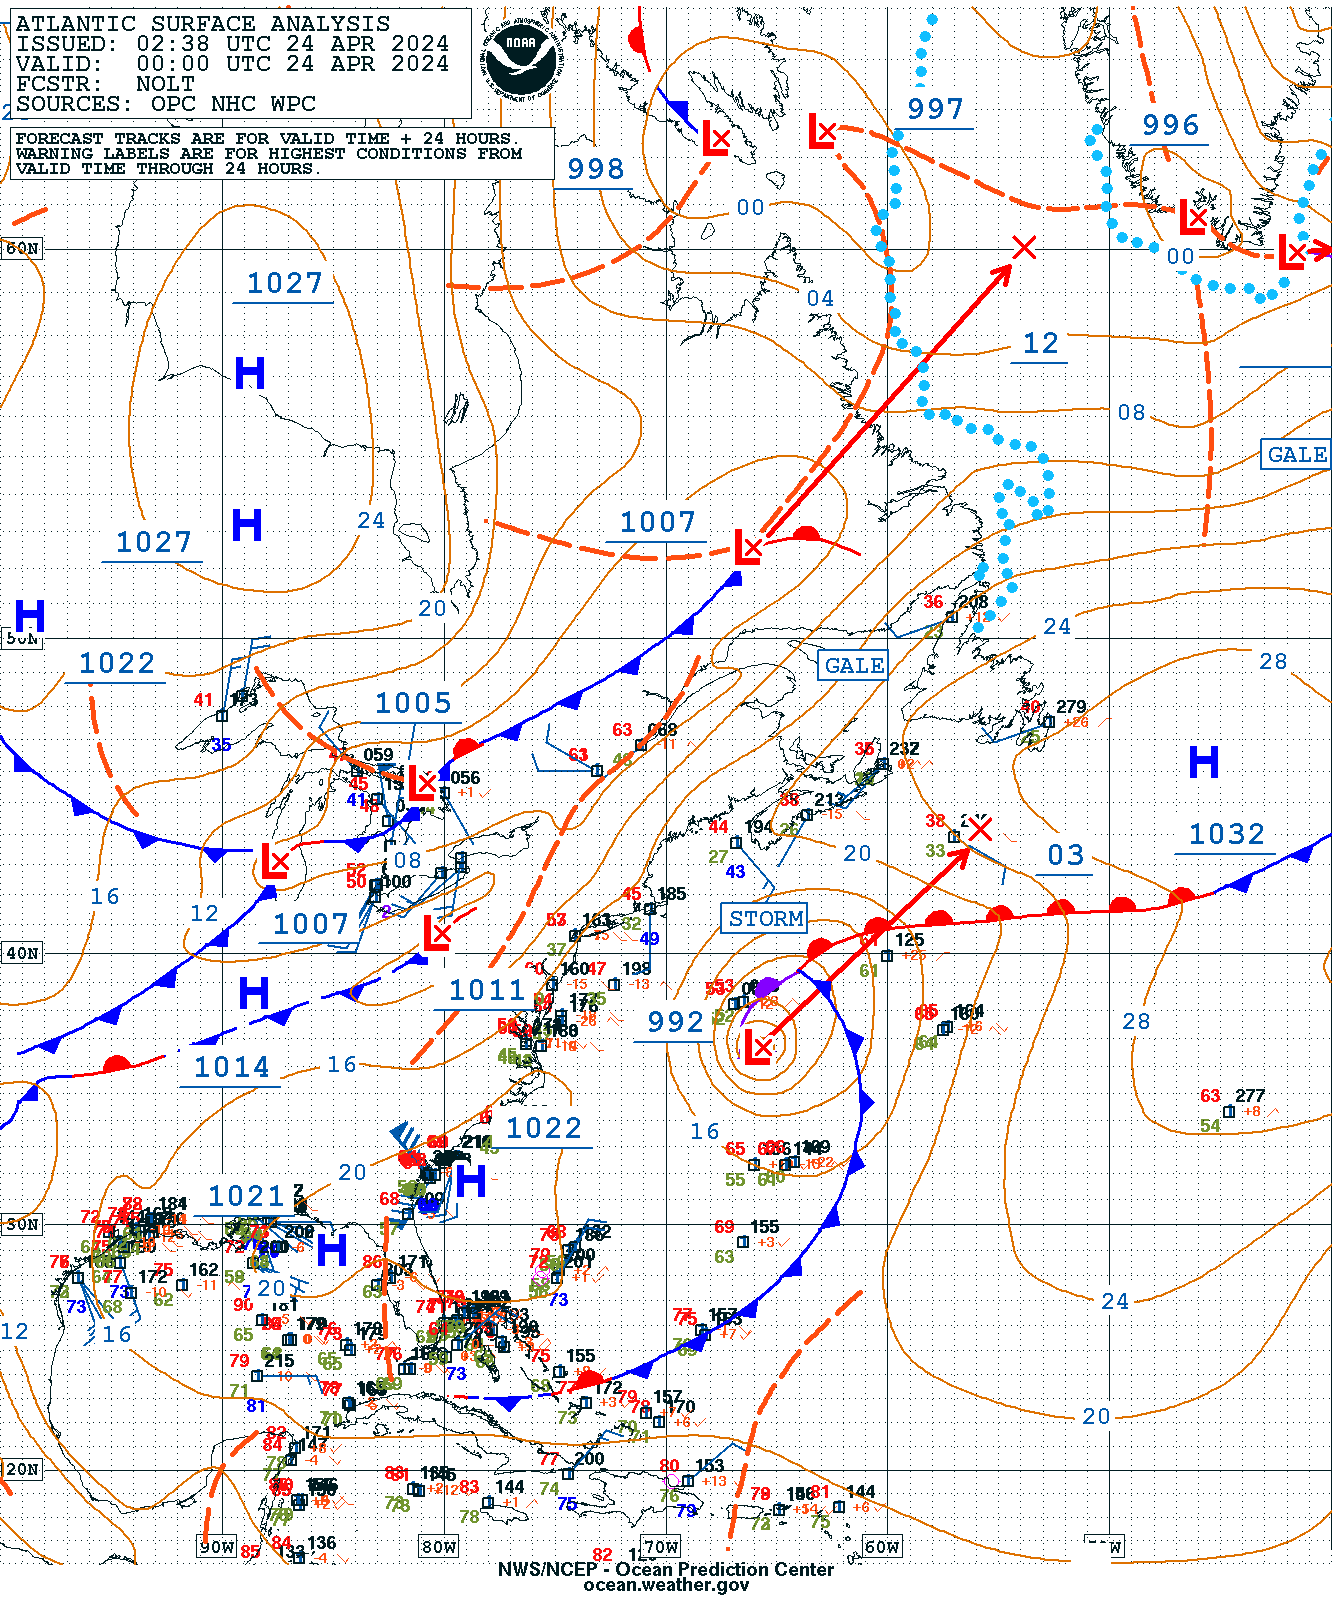
Western Atlantic Surface Analysis
Gulf of Mexico Surface Analysis
National Forecast Maps
Day 1

Pressure/Height Anomalies
MSLP

WPC Short-Term Prog Charts – Surface
6 Hr
12 Hr
3 Hr

6 Hr

WPC Short Term Forecast
WPC Prog Charts – 500 mb
Day 3
24 Hr


Current Warnings/Watches & Discussions
Loading SPC/WPC discussion map…
Area Forecast Discussions
Tampa Area Forecast Discussion
Tallahassee Area Forecast Discussion
Jacksonville Area Forecast Discussion
Melbourne Area Forecast Discussion
Miami Area Forecast Discussion
Key West Area Forecast Discussion
06-09
09-12


Model 700-300 mb Relative Humidity
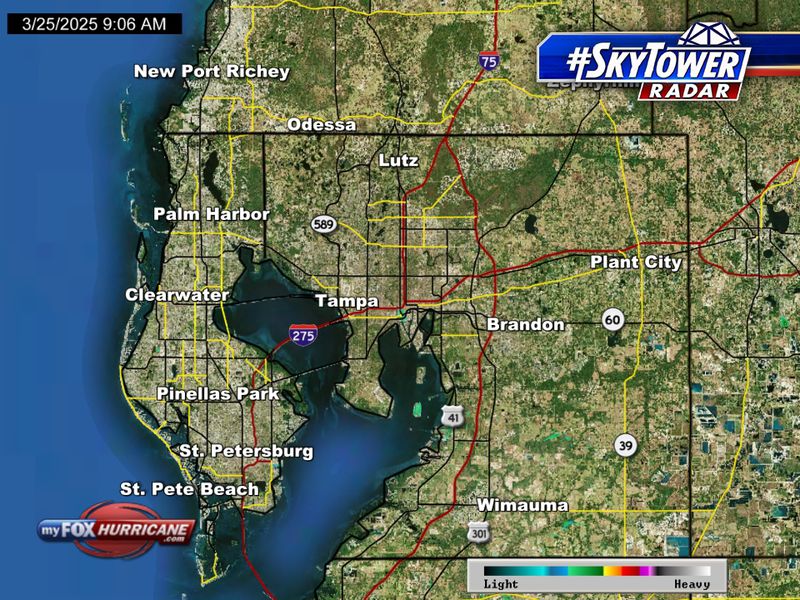
Radar
HRRR Forecast Radar

Lightning
Lightning Density - 15 Minutes
Latest Local METARS

Florida Models
NWS MLB ADAS
Current Model MSLP & 10m Wind
NWS TBW NowCast
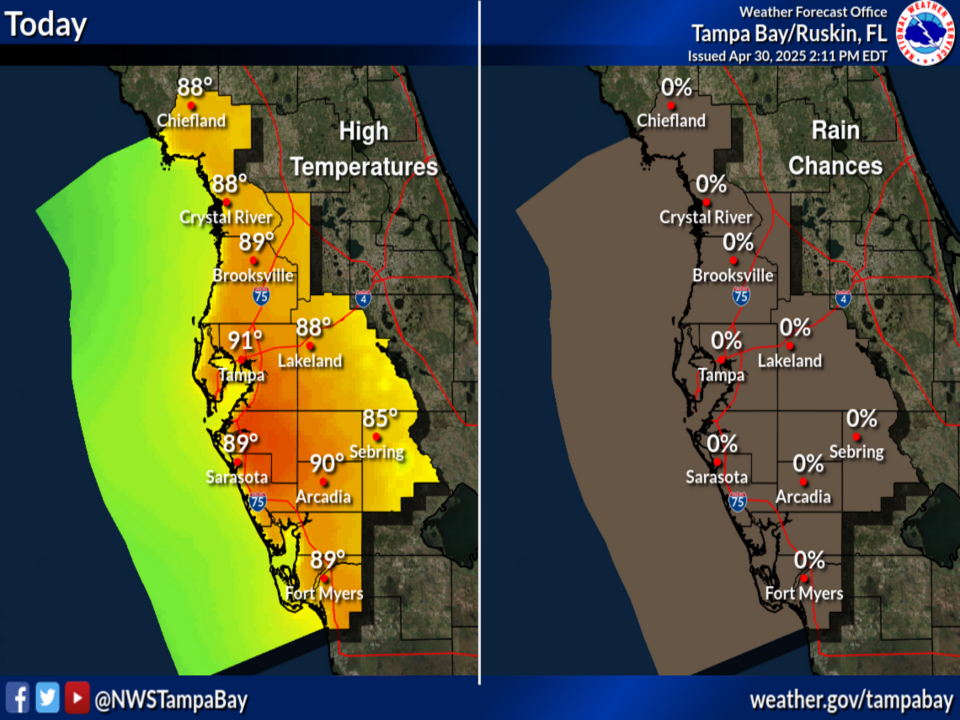
Today
GraphicCast 1

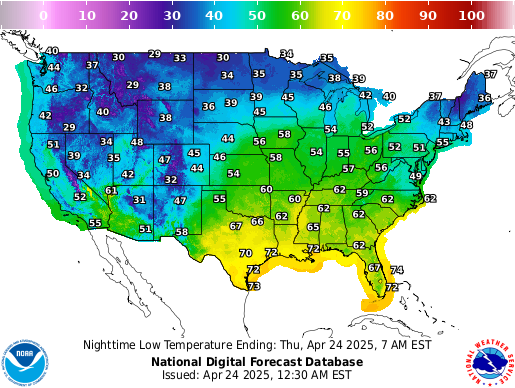
Temperatures
Day 1

Monthly Temperature Outlook

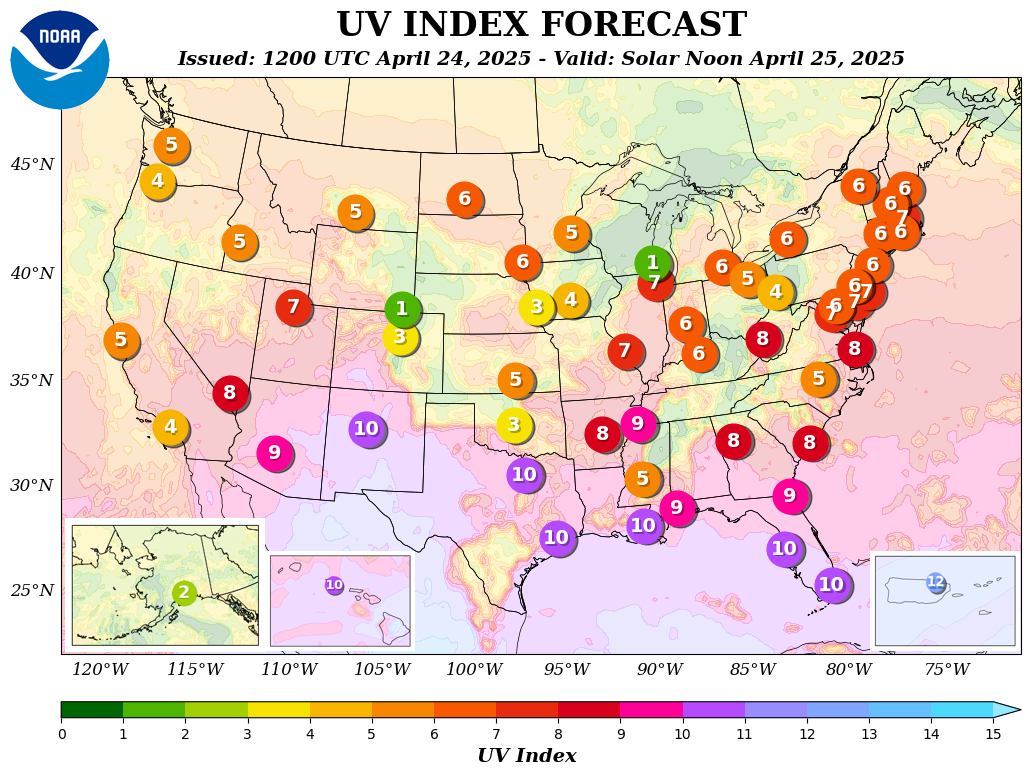
UV Index
Heat Index - Day 1

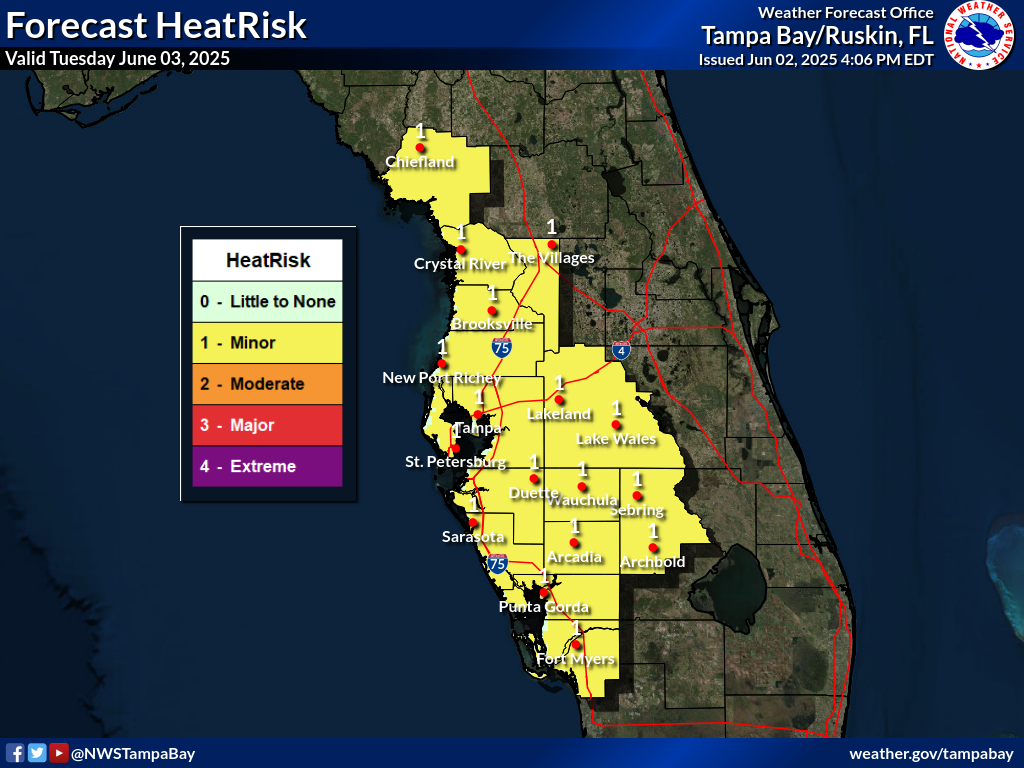
Heat Risk - Day 1
Rain
Day 1

Day 2

Observed 24 Hour Precipitation

GFS 24 Hour Accumulated Rain
Day 1
Day 2

Monthly Precipitation Outlook

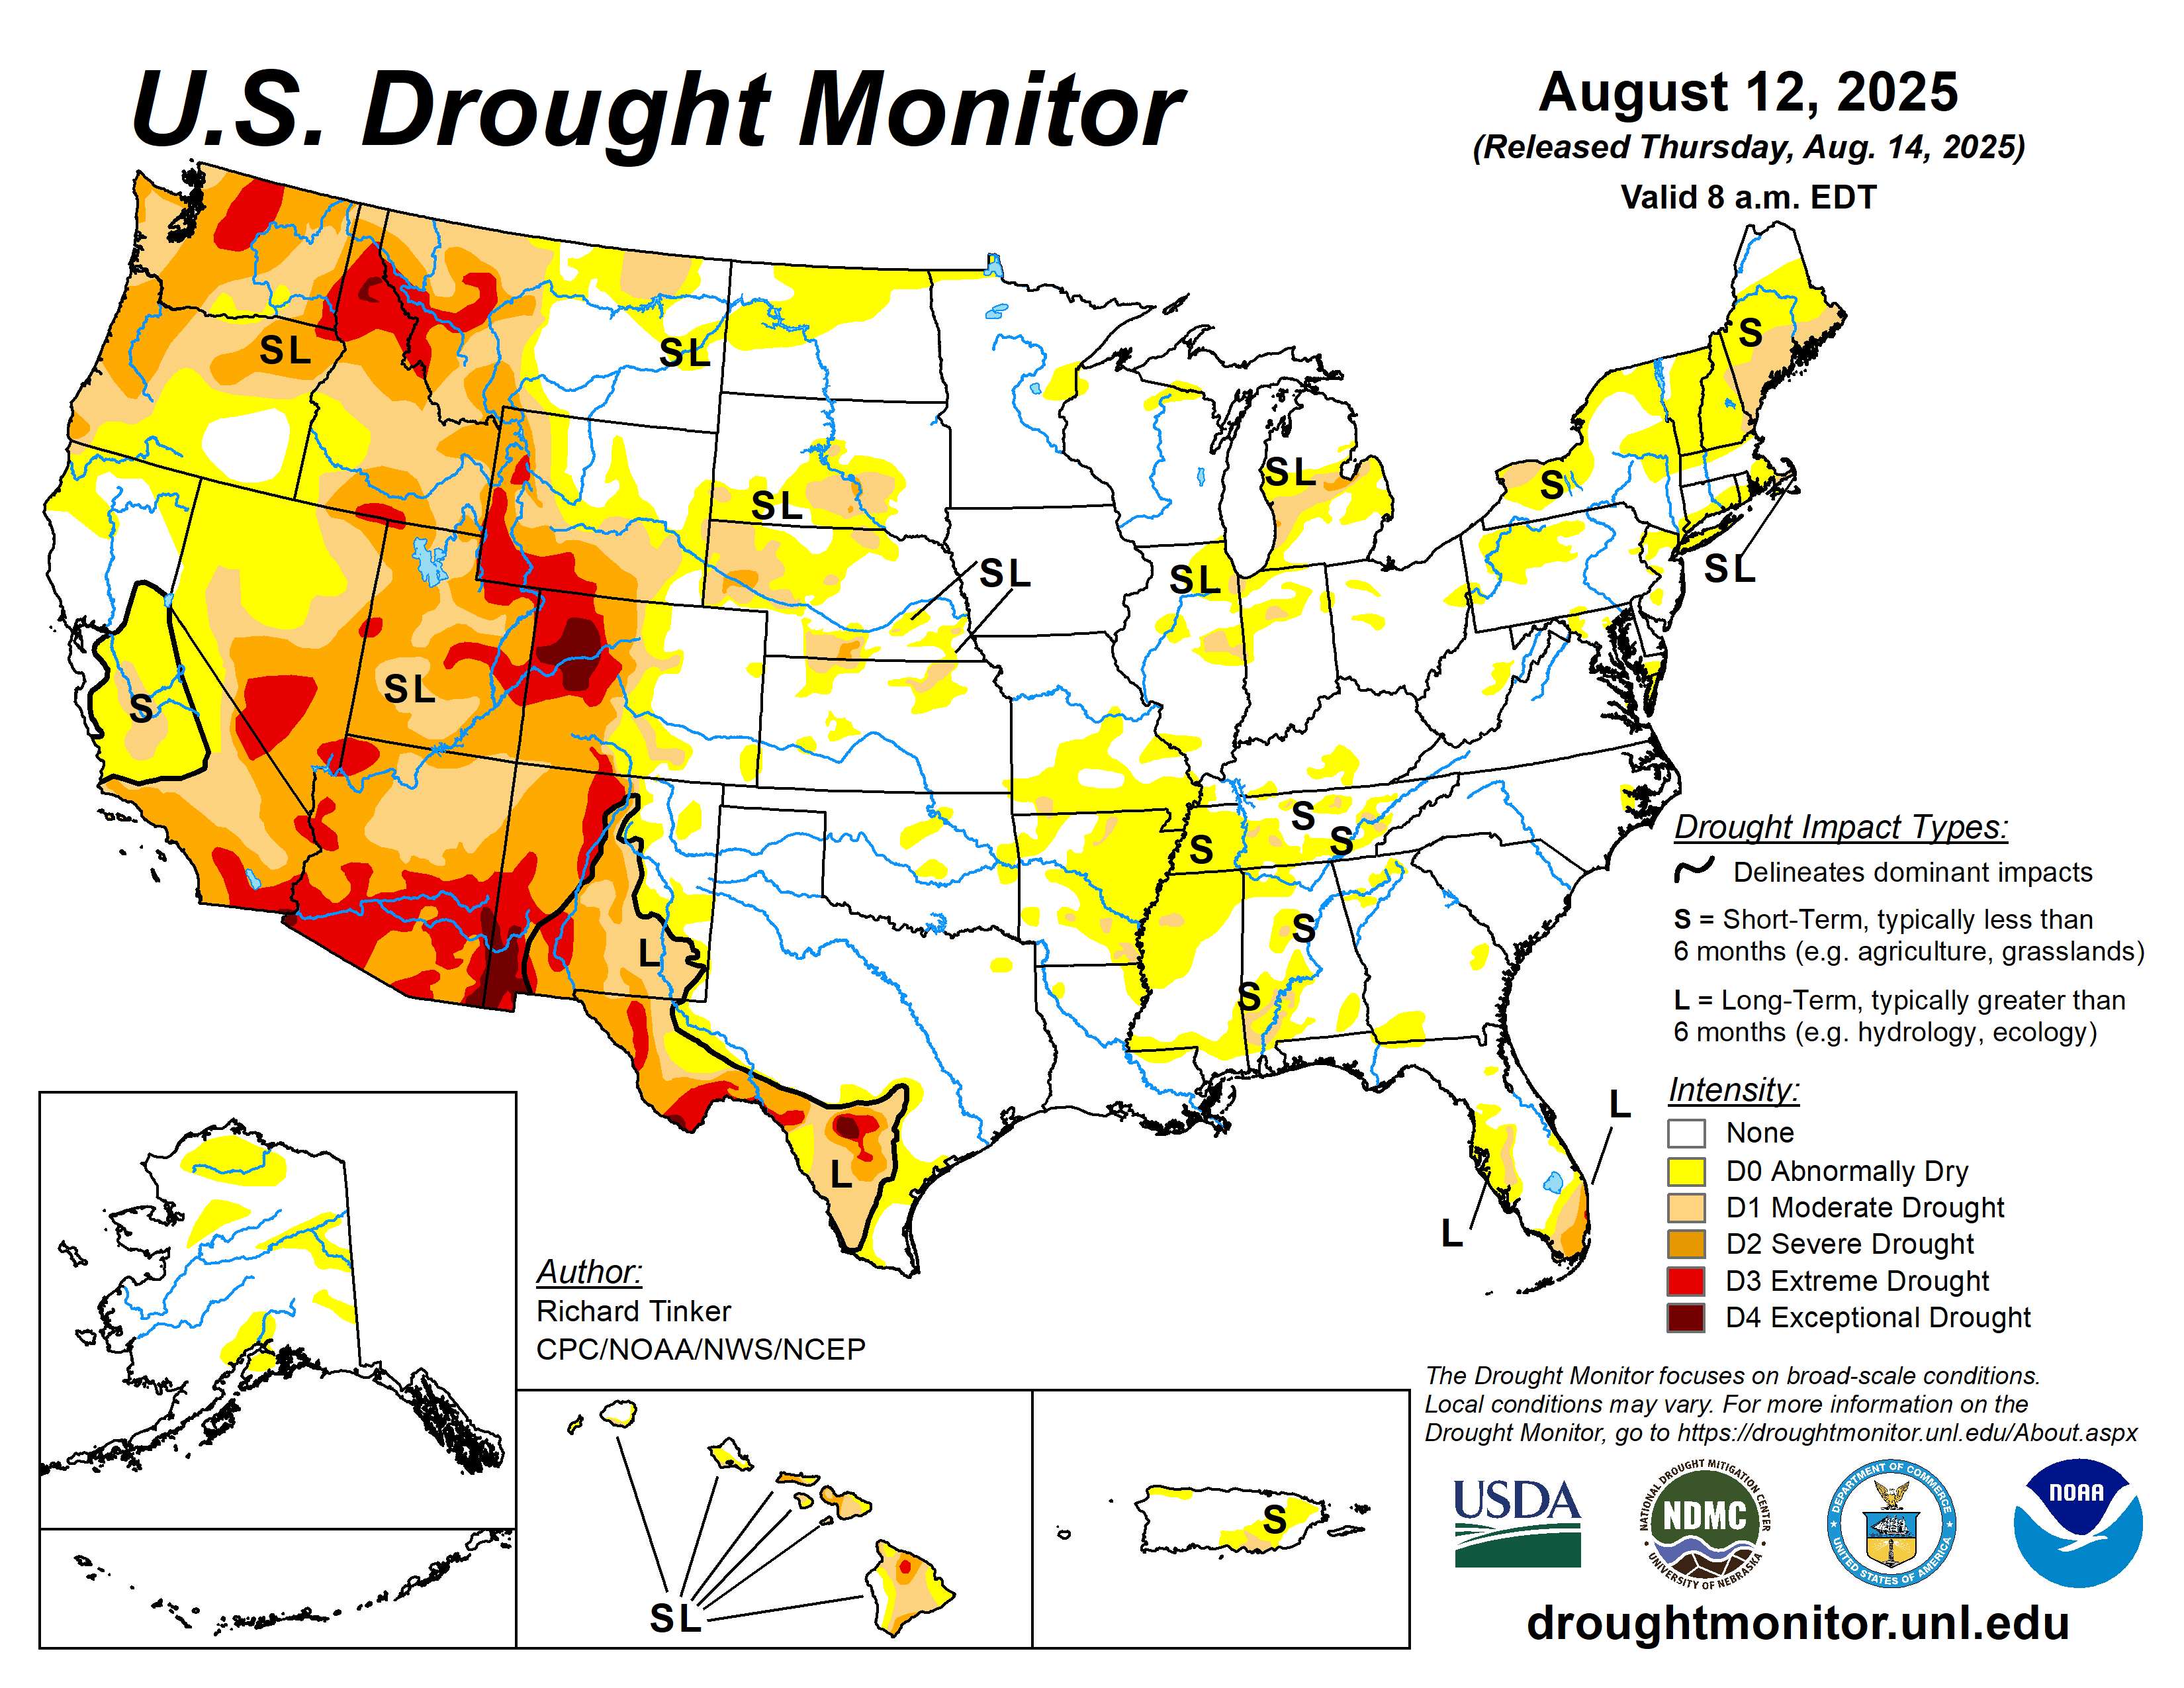
Monitor
Convective Indices
CAPE = Convective Available Potential Energy.
A measure of instability through the depth of the atmosphere, and is related to updraft strength in thunderstorms.
- Weak instability: < 1000
- Moderate instability: 1000-2500
- Strong instability: 2500-4000
- Extreme instability: > 4000
CIN = convective inhibition.
Represents the "negative" area on a sounding that must be overcome for storm initiation.
LI = Lifted Index
The temperature difference between the 500 mb temperature and the temperature of a parcel lifted to 500 mb. Negative values denote unstable conditions.
Theta-e
The higher the value the more unstable. Higher Theta‑e values indicate a greater chance for positive buoyancy. Severe weather and excessive rainfall often occur near or just upstream from a Theta‑e ridge
- > 2: Conv Activity Unlikely
- 0 to 2: Stable
- -3 to 0: Marginally Unstable
- -4 to -6: Moderately Unstable
- -7 to -9: Very Unstable
- < -9: Extremely Unstable
SRH = Storm Relative Helicity
A measure of the potential for cyclonic updraft rotation in right-moving supercells, and is calculated for the lowest 1-km and 3-km layers above ground level. Larger values of 3km SRH (greater than 250 m? s-2) and 0-1 km SRH (greater than 100 m s-3) suggest an increased threat of tornadoes with supercells.
Atmospheric Sounding

Skew-T Diagram Cheat Sheet
1. Axes and Basic Layout
- X-Axis (Bottom): Temperature in °C (skewed right with height)
- Y-Axis (Left): Pressure in hPa (logarithmic scale)
- Isobars: Horizontal constant pressure lines (e.g., 1000, 850, 700, 500, 300 hPa)
- Isotherms: Diagonal lines (skewed right); constant temperature
- Dry Adiabats: Curved, upward-right; dry parcel ascent path
- Moist Adiabats: Curved, upward-left; saturated parcel ascent path
- Mixing Ratio Lines: Dashed, upward-right; constant dew point depression
2. Key Plotted Lines
- Environmental Temperature: Red or black solid line (actual air temperature)
- Dew Point Temperature: Green or blue solid line (moisture profile)
- Parcel Ascent Line: Usually yellow or dashed; follows adiabats for lifted parcel
3. Wind Barbs (Right Margin)
- Full barb: 10 knots
- Half barb: 5 knots
- Pennant (flag): 50 knots
- Direction: Where wind is coming from
4. Important Atmospheric Features
| Feature | Interpretation |
|---|---|
| LCL (Lifting Condensation Level) | Cloud base; where T and Td converge |
| LFC (Level of Free Convection) | Parcel rises freely; indicates instability |
| EL (Equilibrium Level) | Parcel cools below environment; near cloud top |
| CAPE | Positive energy; >1000 J/kg = storms; >2500 = strong storms |
| CIN | Negative energy; CIN > 50 J/kg may suppress convection |
| Inversion | Temp increases with height; suppresses convection |
| Dry Layer | Large T-Td difference; limits clouds/enhances downdrafts |
| Moist Layer | Small T-Td difference; promotes fog/clouds near surface |
5. Rule-of-Thumb Values
Instability – CAPE
| CAPE | Interpretation |
|---|---|
| 0–500 J/kg | Stable / weak convection |
| 500–1000 | Marginal instability |
| 1000–2500 | Moderate instability |
| 2500–3500 | Strong instability |
| >3500 | Extreme (severe storm potential) |
Wind Shear (0–6 km Bulk Shear)
- <20 kt: Weak shear – pulse storms
- 20–35 kt: Moderate shear – organized storms possible
- >35 kt: Strong shear – supercells/severe potential
Lapse Rate (700–500 hPa)
- >6.5°C/km: Steep lapse rate = more instability
- <6.0°C/km: Stable or neutral layer
6. Specialized Indicators
| Indicator | What to Watch For |
|---|---|
| Veering Winds | Clockwise with height; warm-air advection |
| Backing Winds | Counterclockwise; cold-air advection |
| Critical Thickness (~540 dam) | Useful for winter snow prediction |
| Dry Slot | Mid-level dry air; evaporation/microburst risk |
7. Example Scenarios
Thunderstorm Likely
- CAPE > 1000 J/kg
- LCL < 1500 m
- LFC present
- Wind shear > 20 kt
- CIN < 25 J/kg
Fog Formation
- Surface T ≈ Td
- Saturated boundary layer
- Light/calm winds
- Surface inversion
Supercell Environment
- CAPE > 2000
- Shear > 40 kt
- High lapse rates
- Veering winds with height
Marine Forecasts
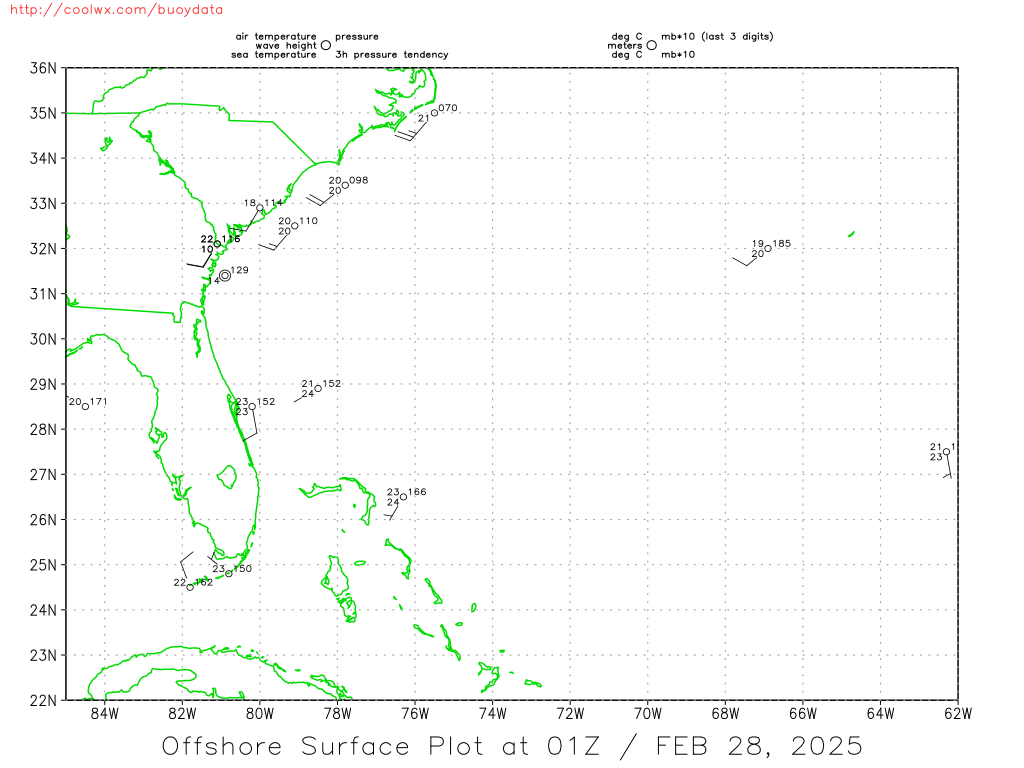
Coastal Forecast
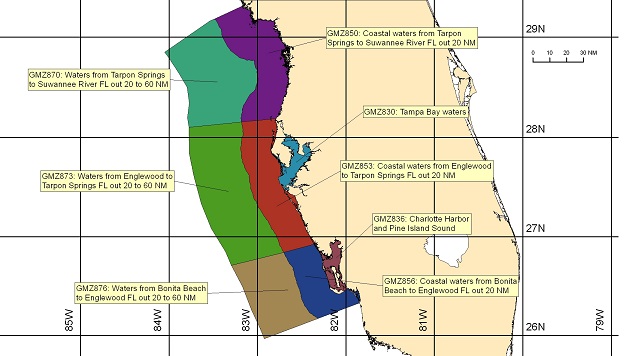
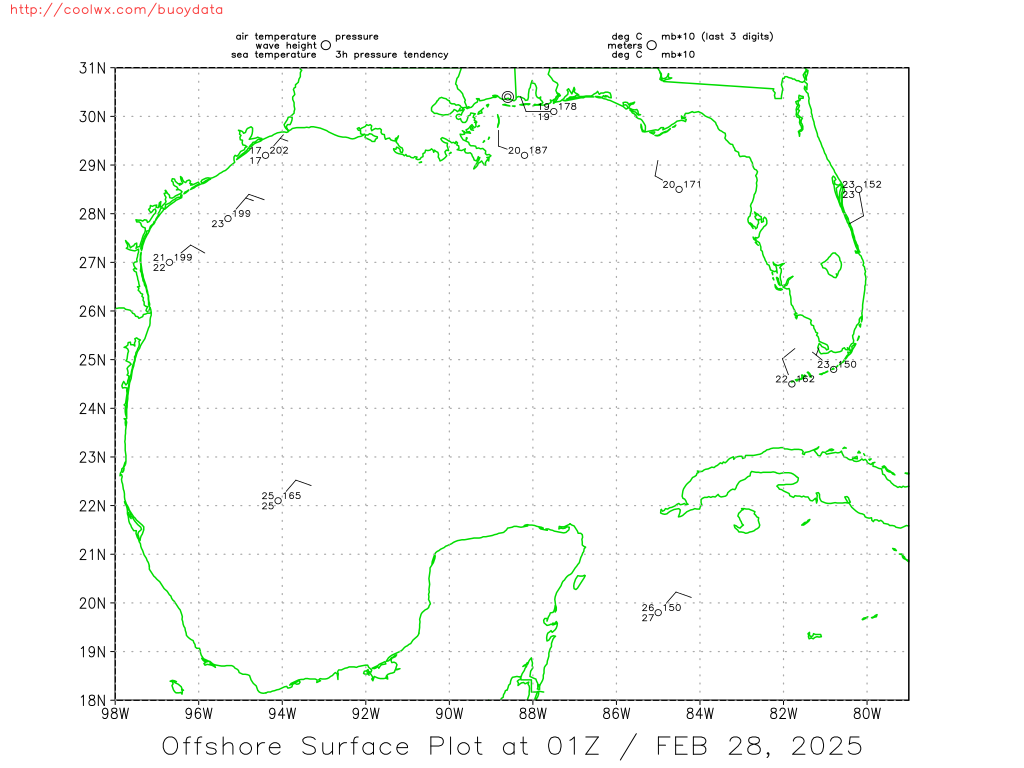
Offshore Forecast - Gulf of Mexico
SLOSH ETSS - St. Pete
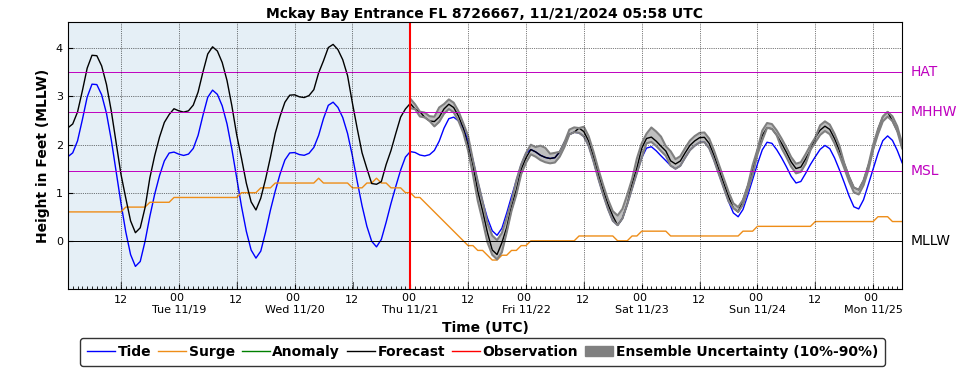
P-ETSS NAEFS Hillsborough Bay
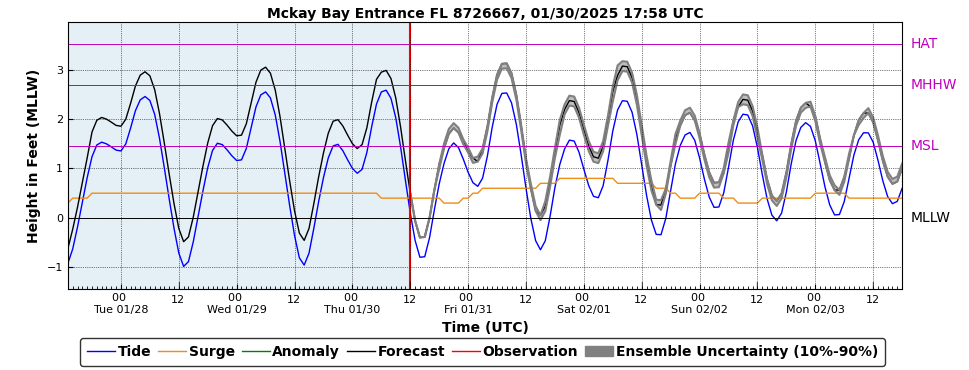
P-ETSS GEFS Hillsborough Bay
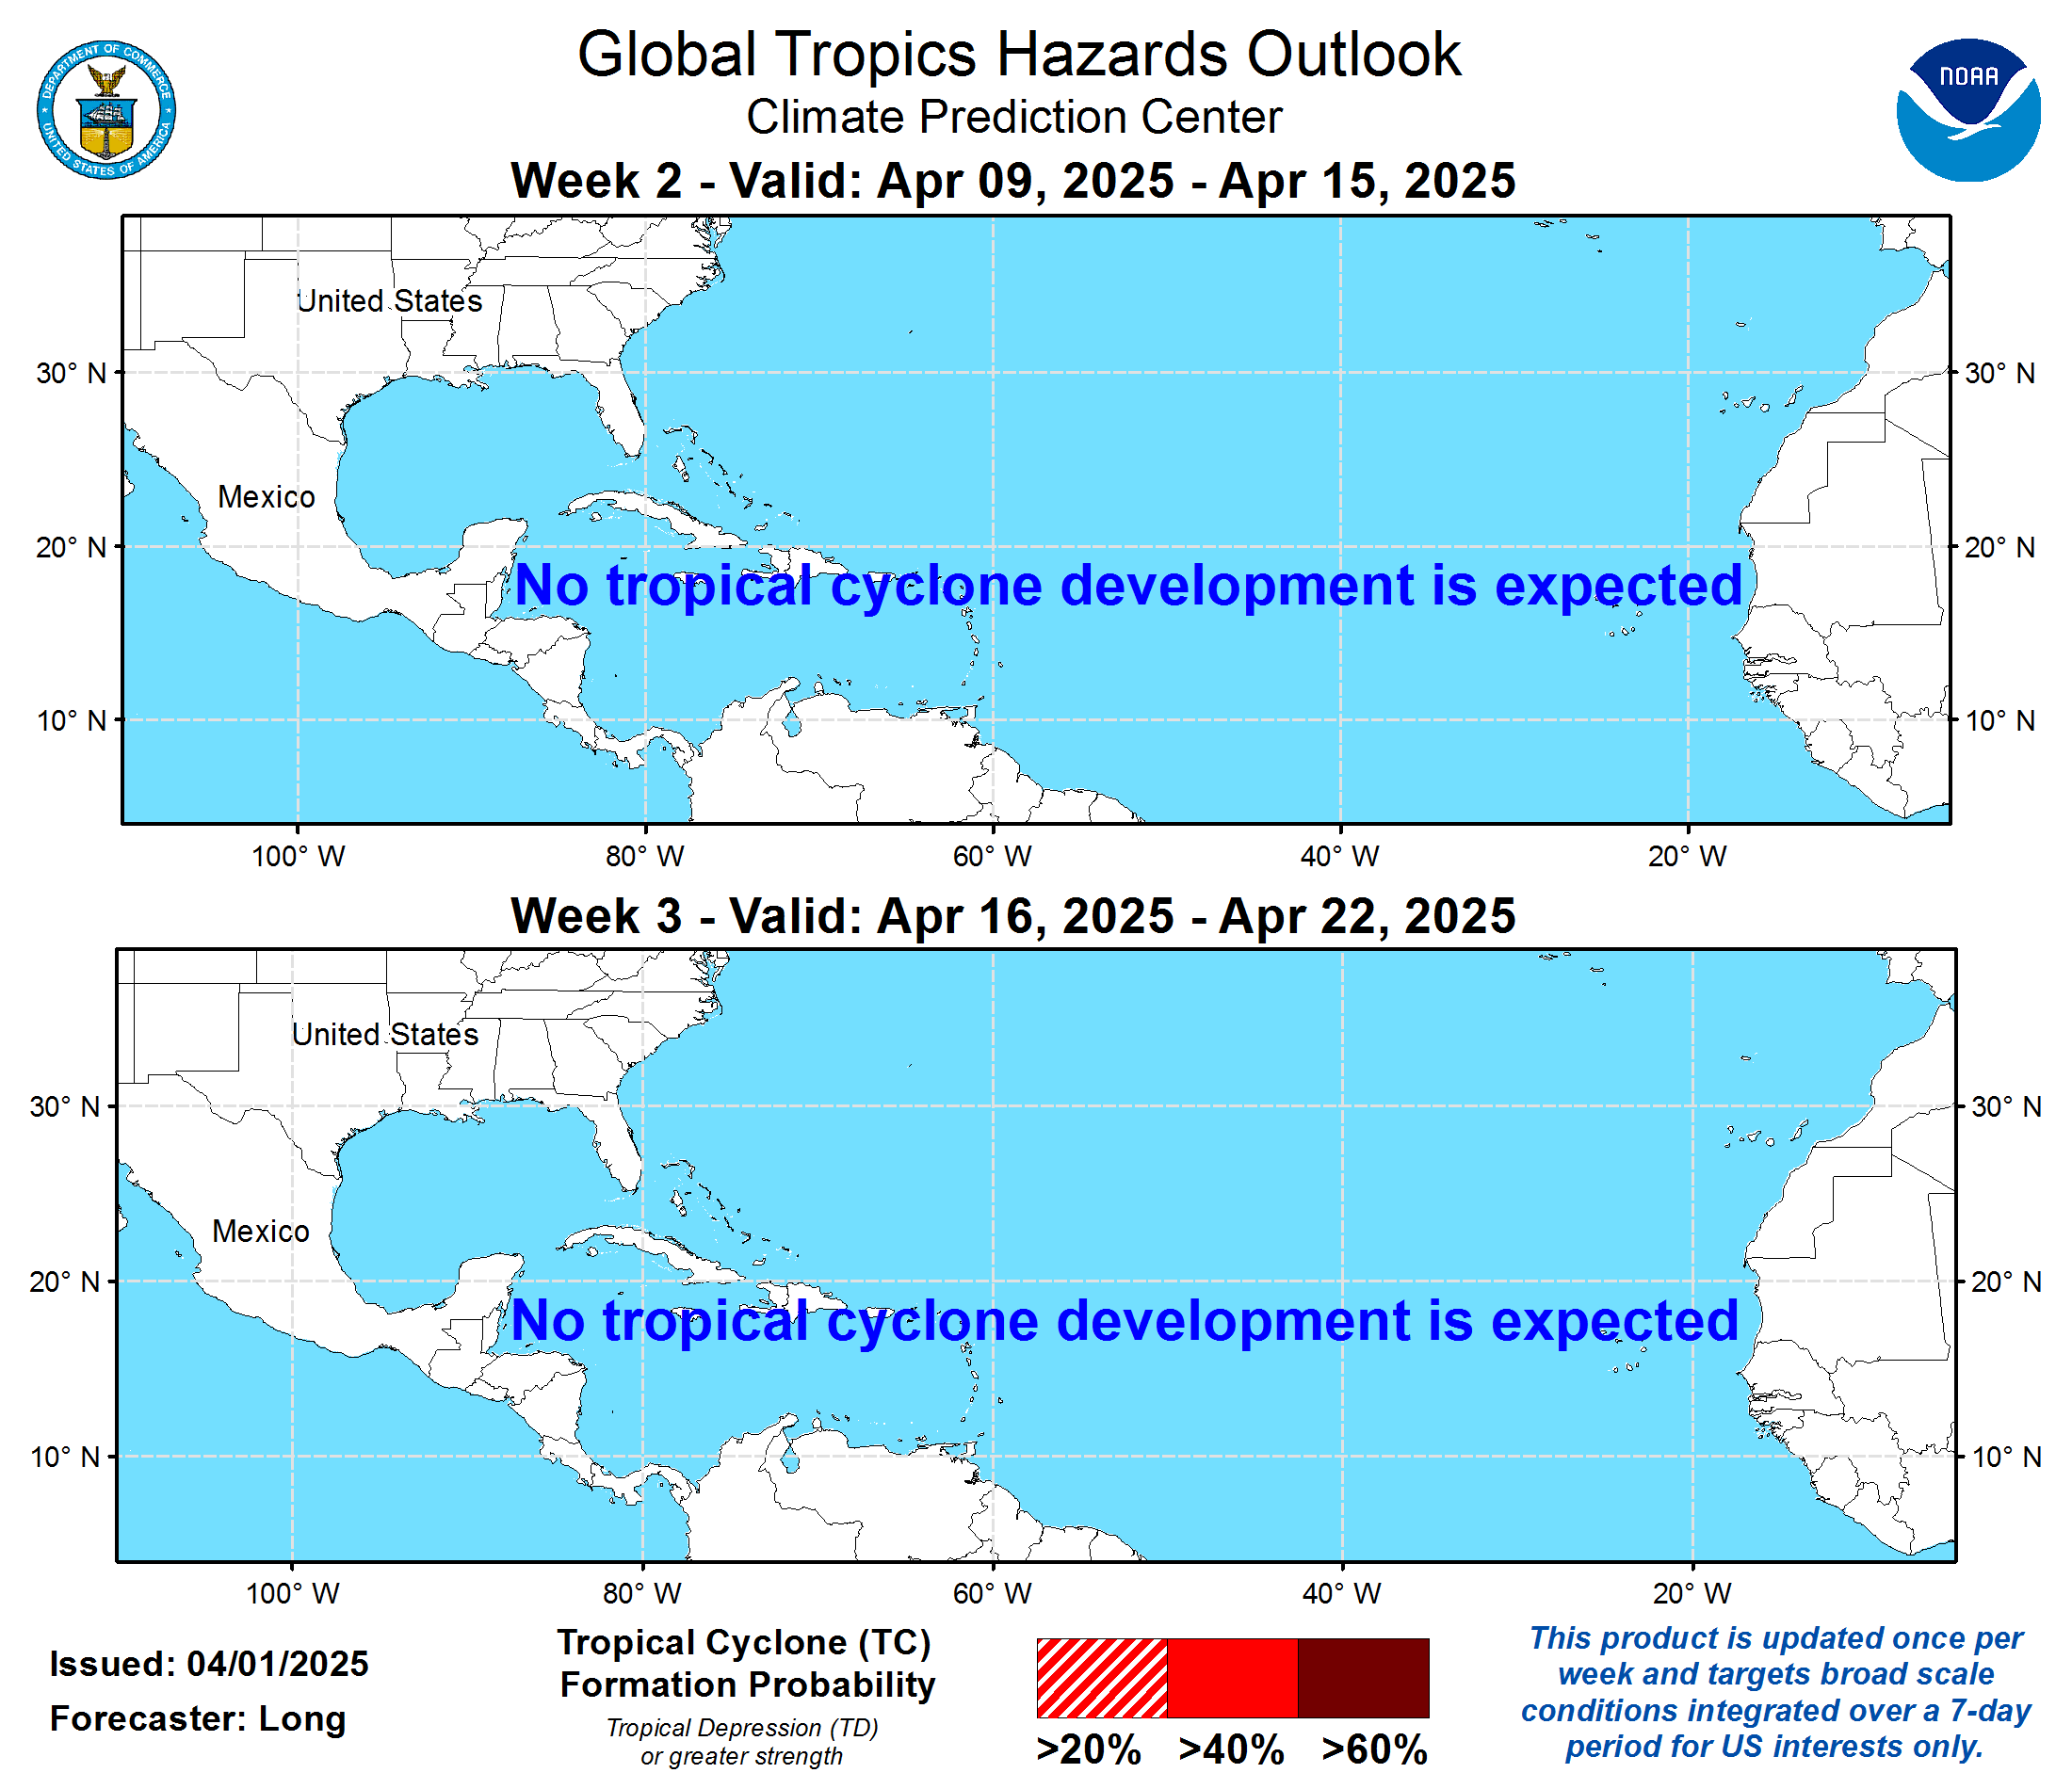
NHC Outlook
2 Day Outlook

7 Day Outlook

Active Tropical Cyclones (PTC and higher)
Tropical Atlantic Surface Analysis
Experimental/Academic Tropical Resources
- Tropical Tidbits Aircraft Reconnaissance
- NOAA STAR Aircraft Reconnaissance
- Tomer Burg's TroPYCal
- CyclonicWX
- Brian Tang's Tropical Trends
- NCEP Hurricane Model Archive
- Historical Hurricane Tracks
- Google DeepMind Hurricane AI Public Preview
- Morphed Integrated Microwave Imagery at CIMSS (MIMIC-TC)
- Colorado State Current Season ACE
- NHC Current/Historical Hurricane Seasons and TC Reports
- Cuban National Radar
2026 Atlantic Hurricane Season Tracks

0-168 hr

0-48 hr

0-120 hr


0-120hr Verification This Season

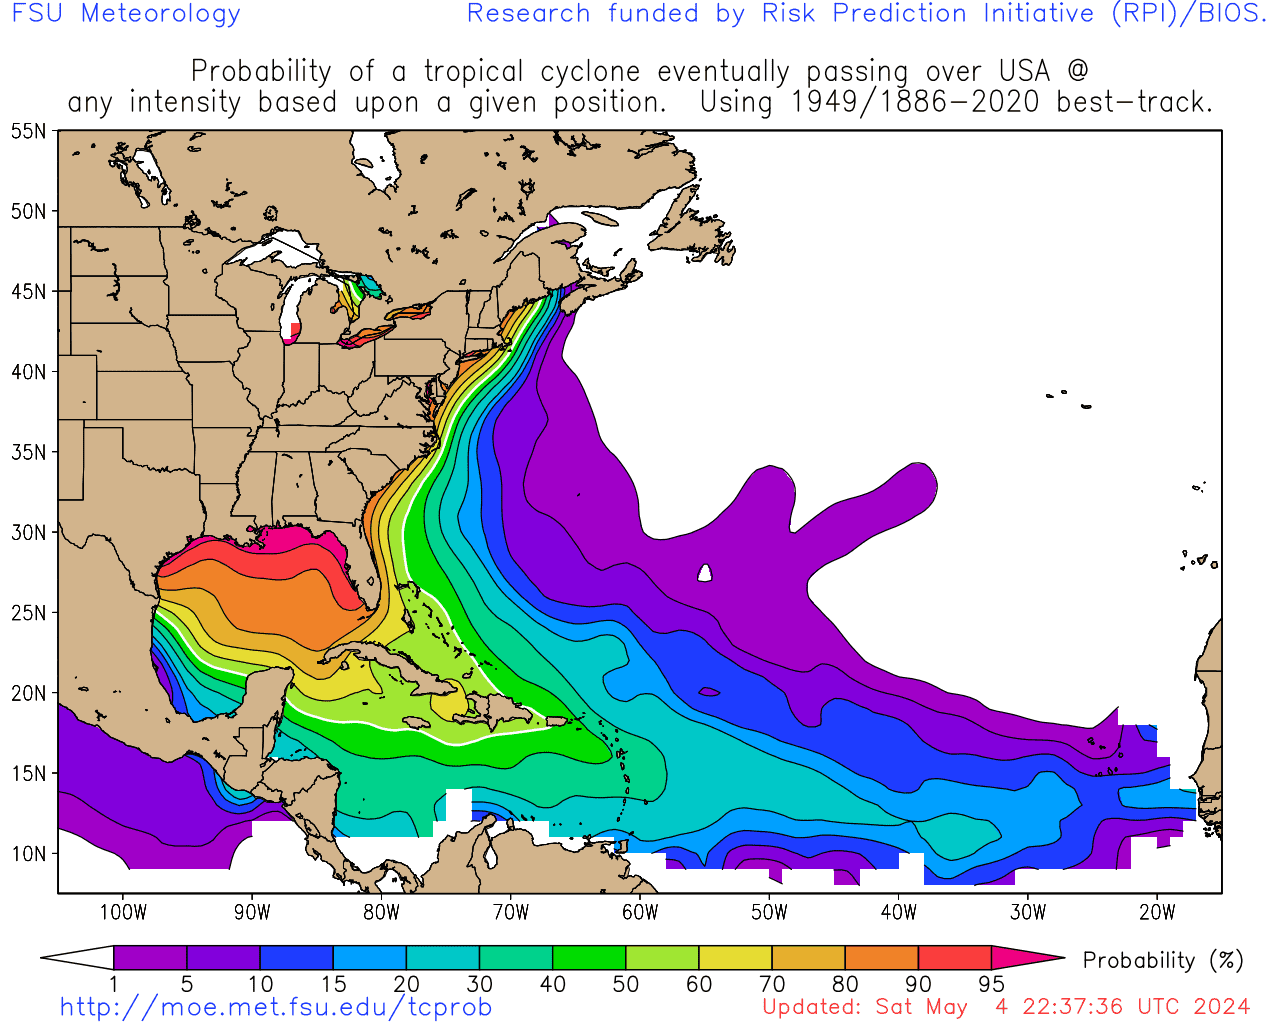
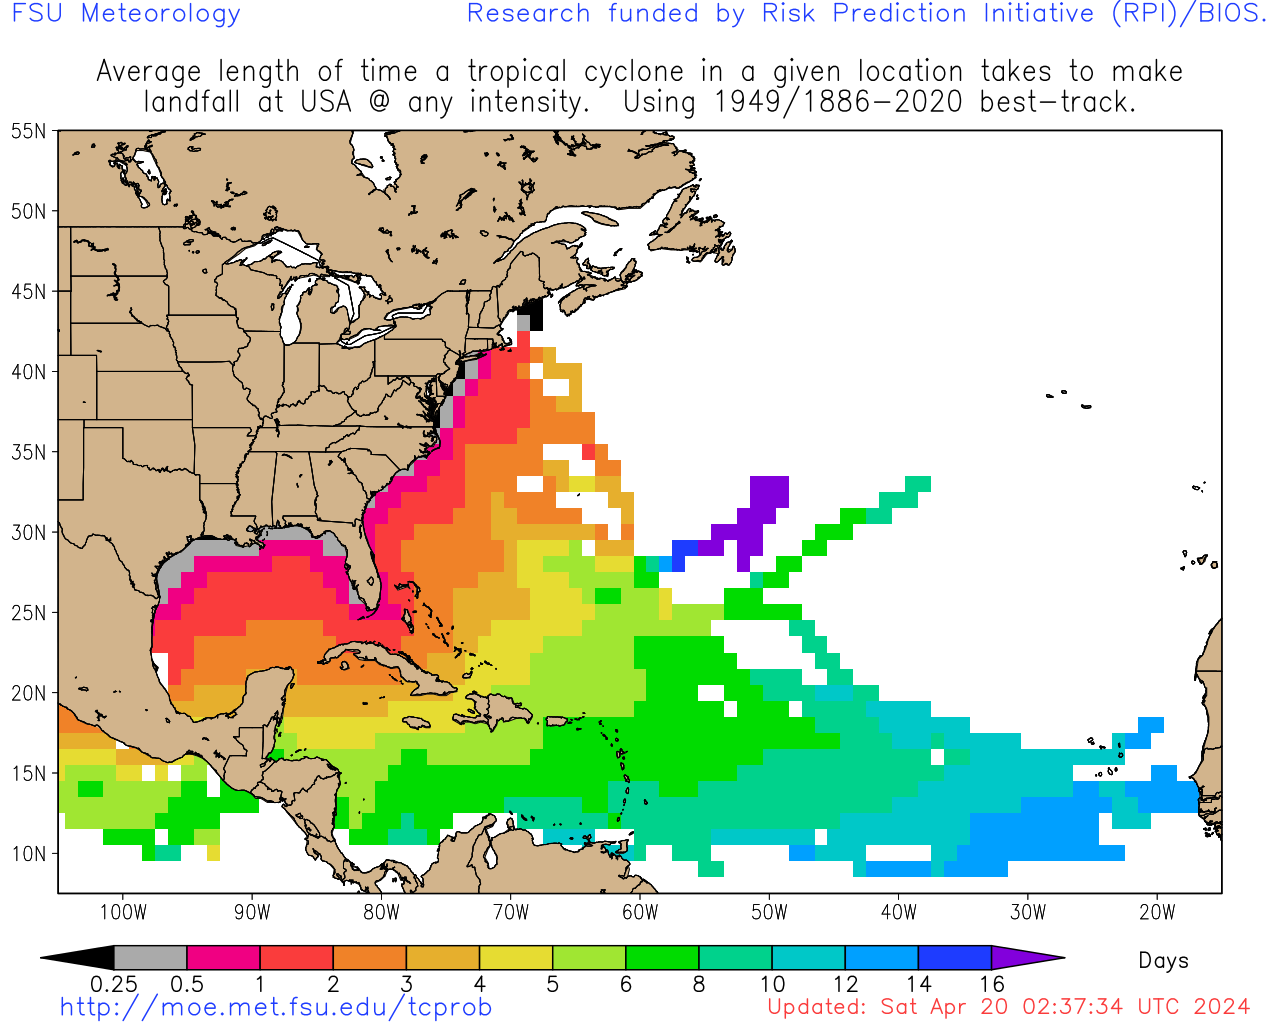
NOTE: These statistics ignore completely the current intensity or motion of the storm
and are based solely on a climatology based on the current position. They are prone to large forecast error.
Users should use only official forecasts for decisions, such as those provided by NHC, JTWC, and CHC.
CONUS / Florida
CONUS - Any Intensity
Average Arrival Time

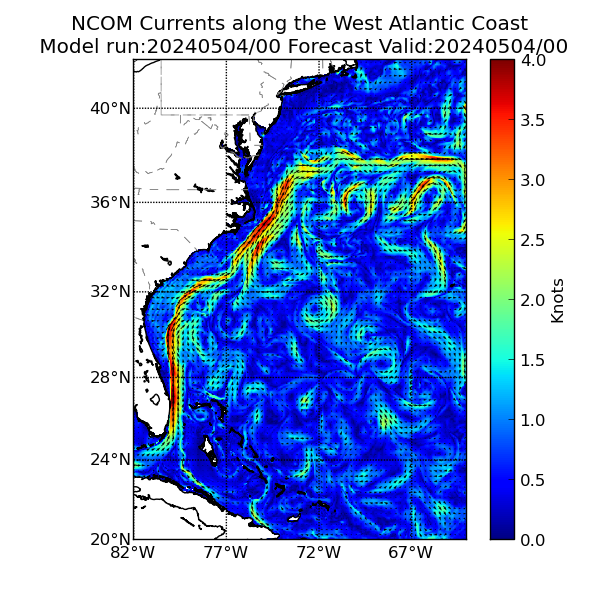
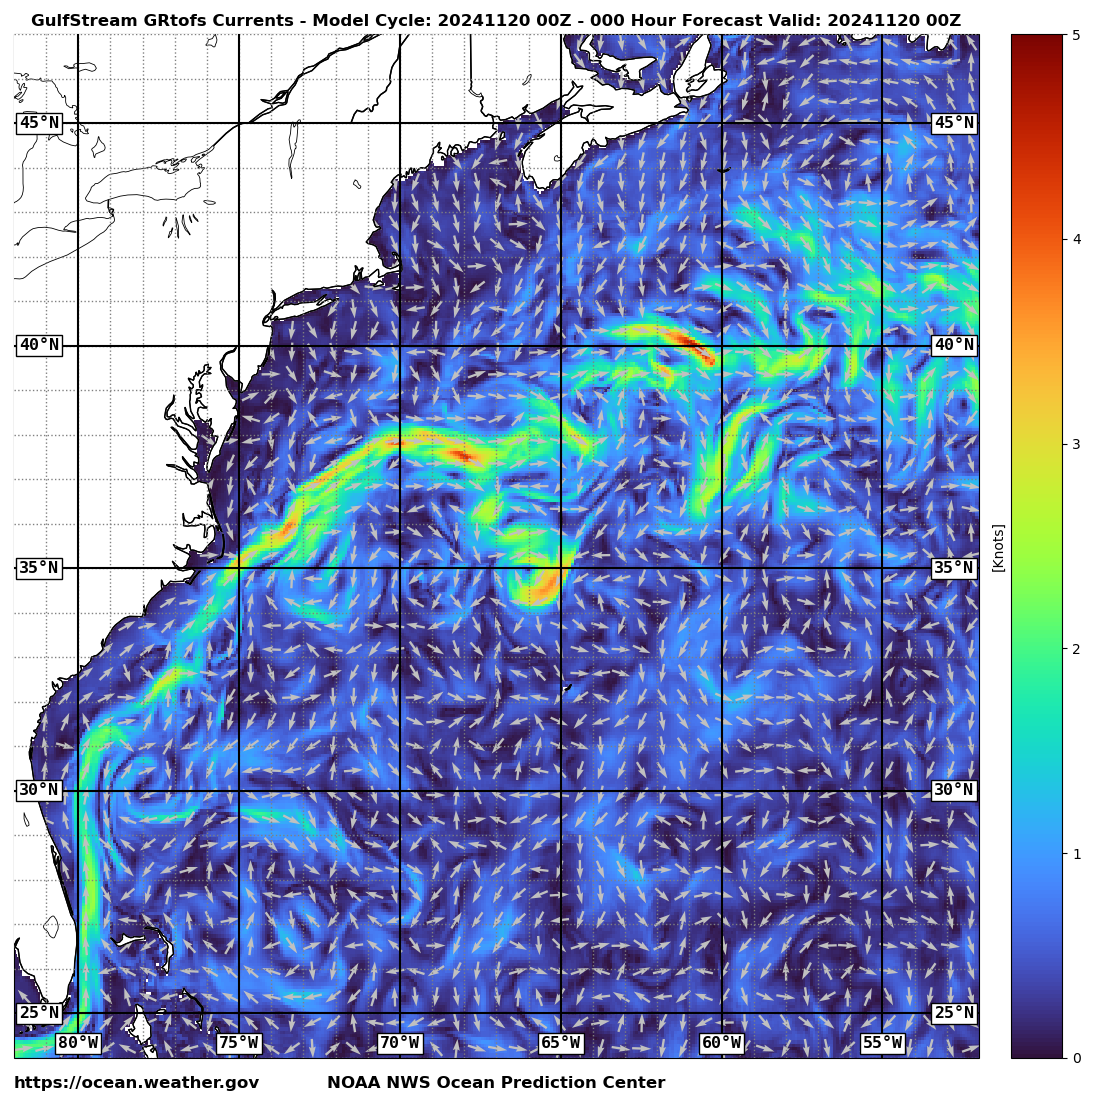
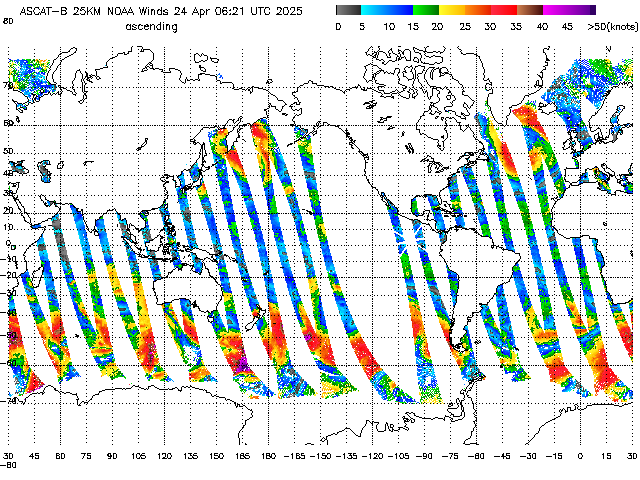
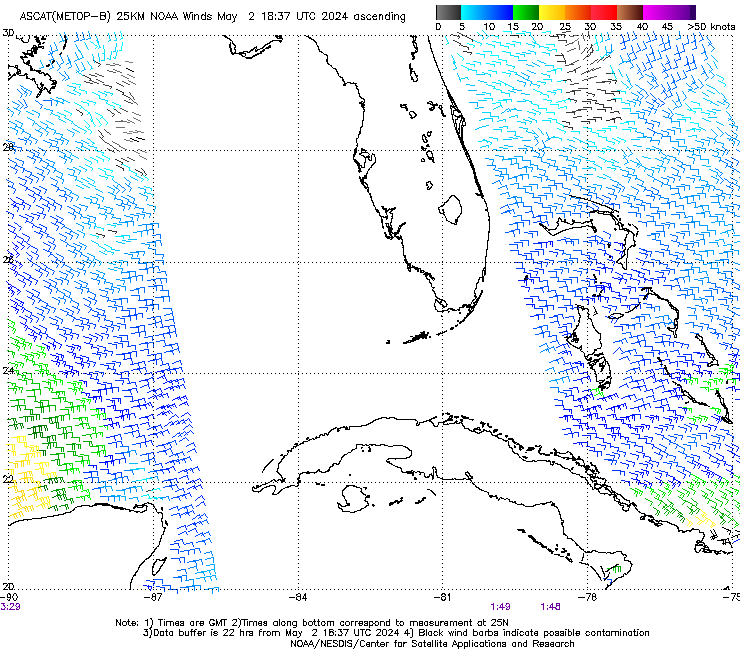
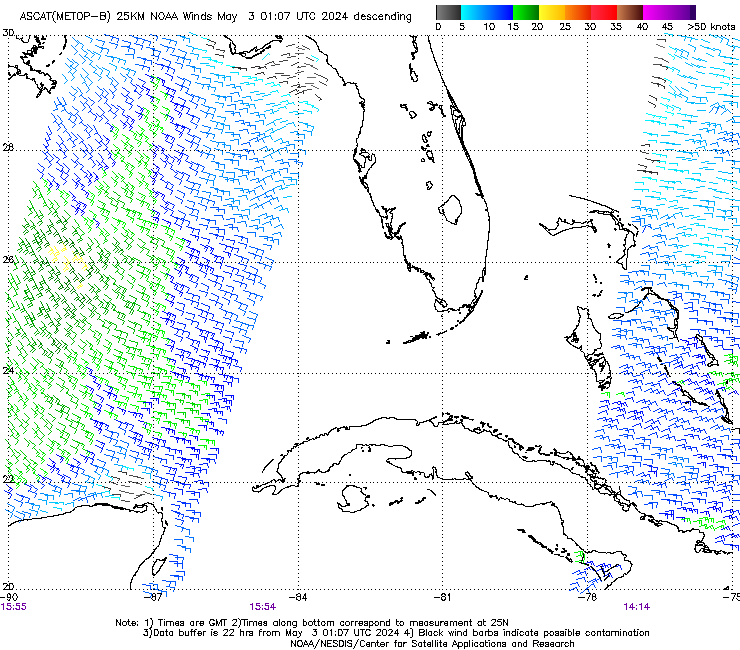
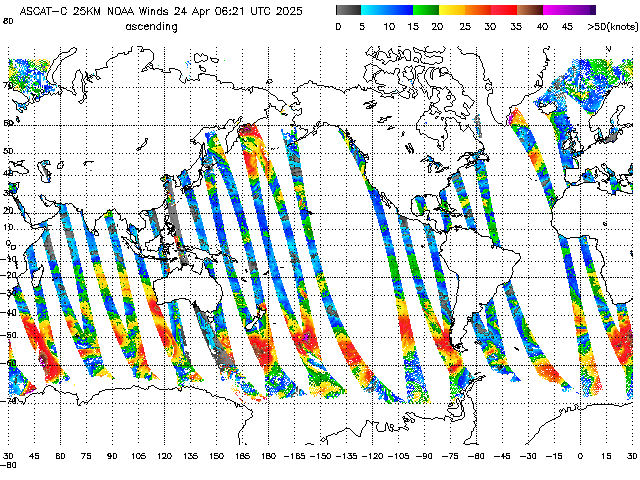
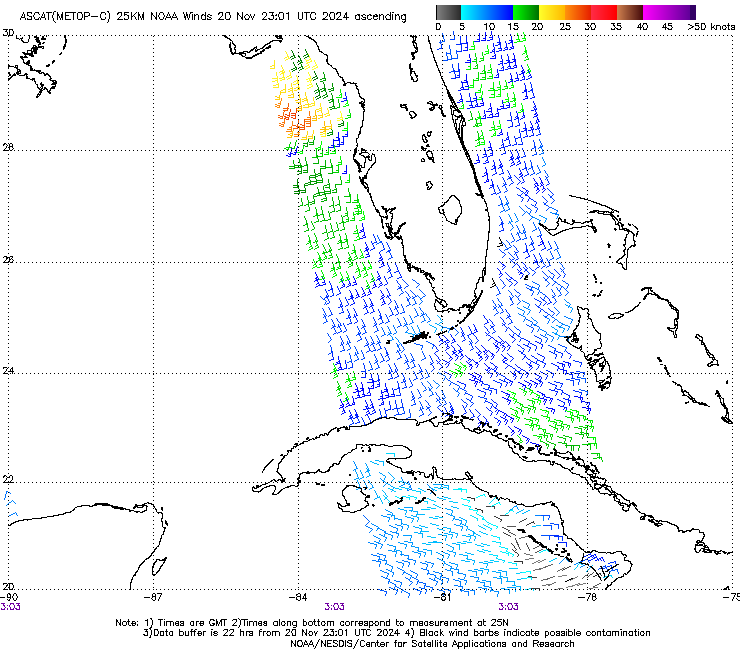
Mariner Guidance
500 mb Vorticity
Shear Support
Divergence & Convergence
Generalized Shear


Vertical Instability


Mid Atmospheric Winds


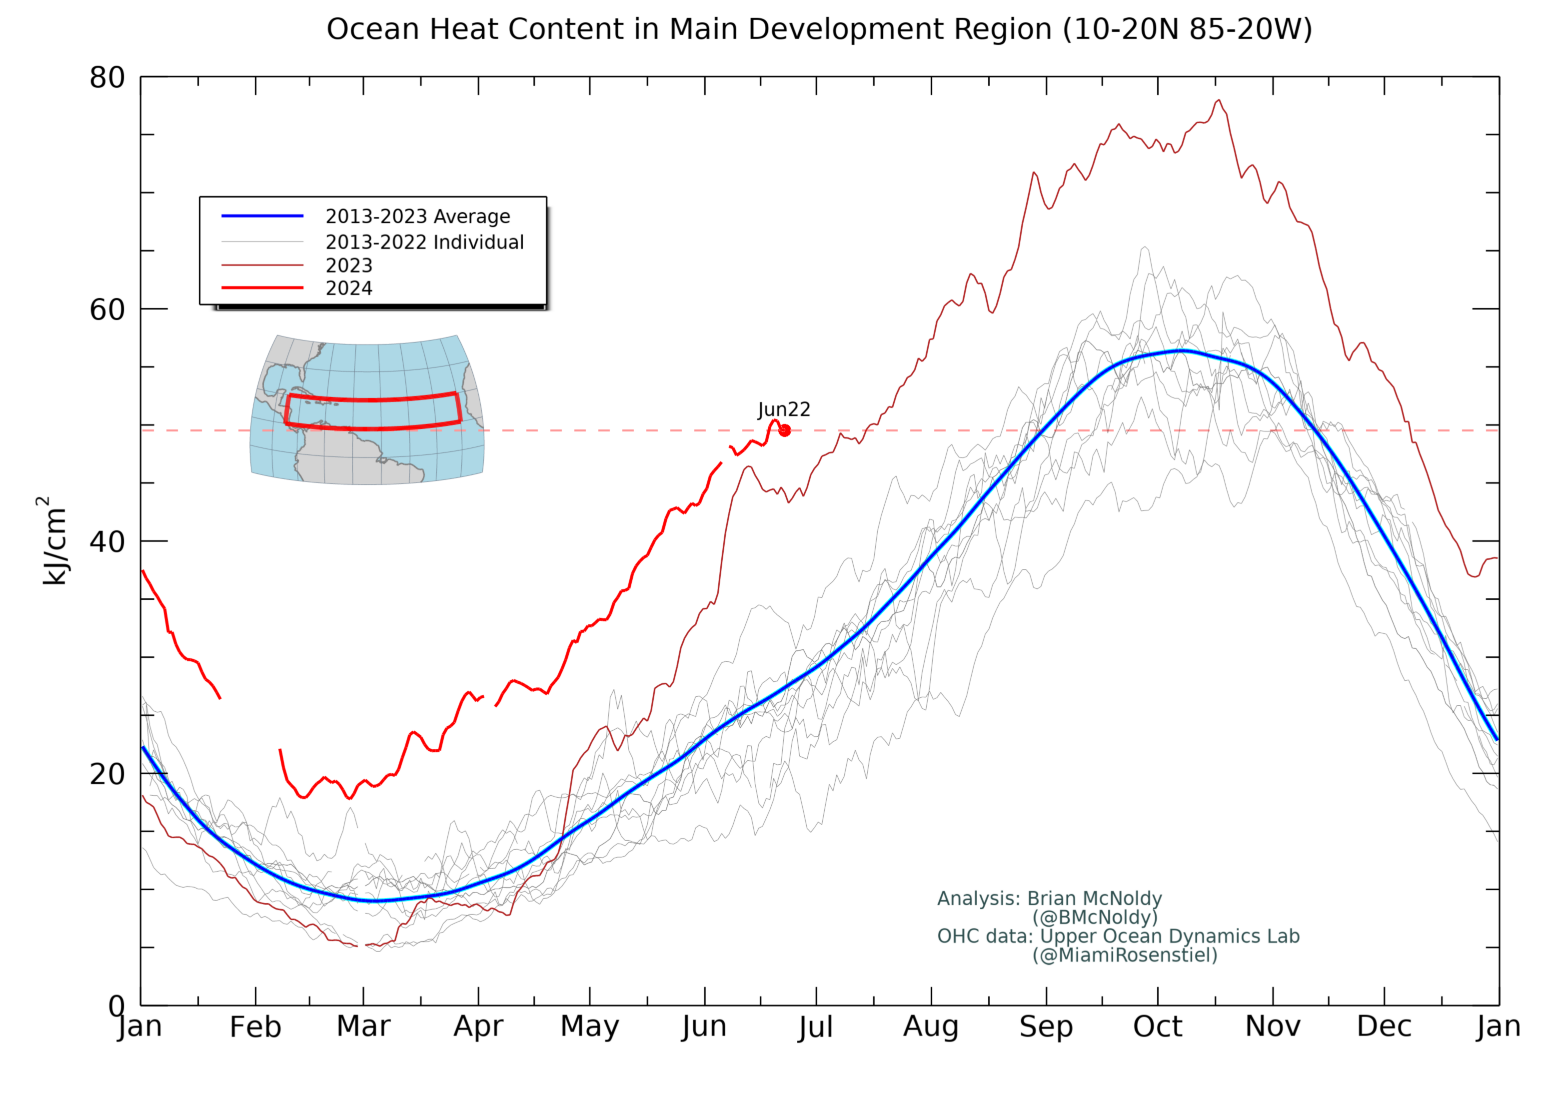
Ocean Heat Content

Ocean Heat Content Anomaly

Main Development Region

Day 1

Day 2

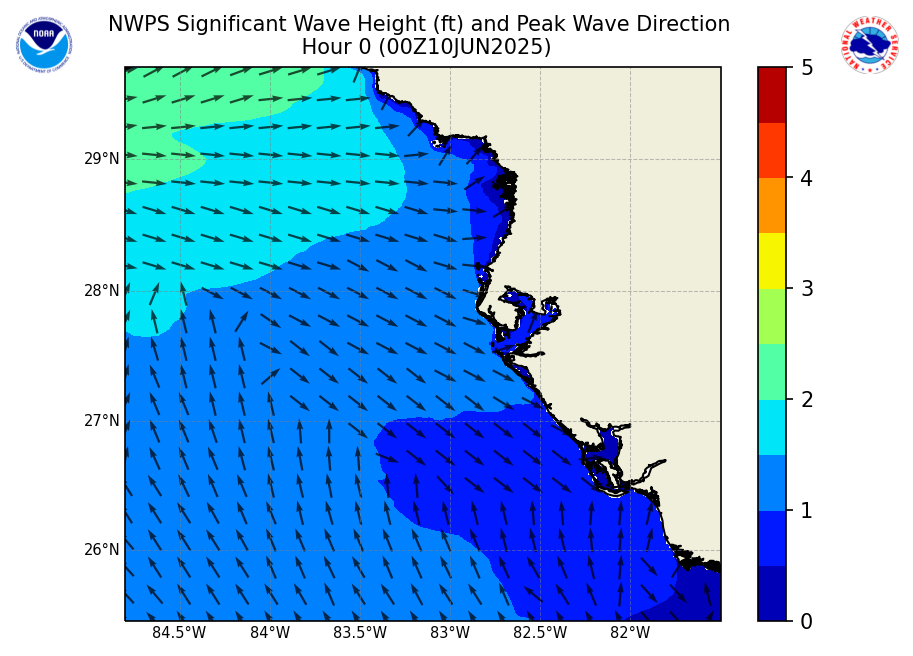
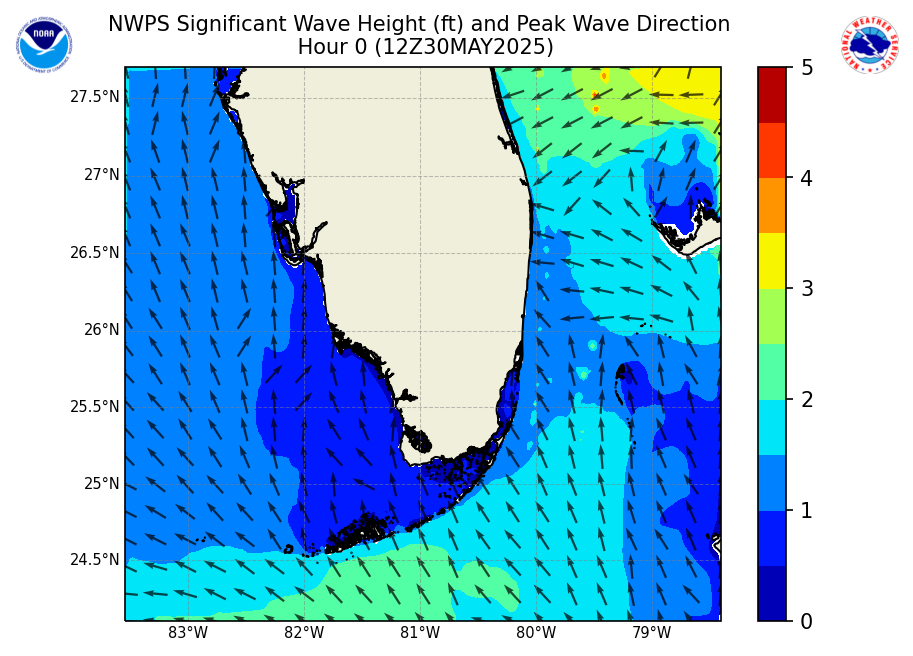
Waves
NWPS Significant Wave Height
Oceanweather Wave Forecasts
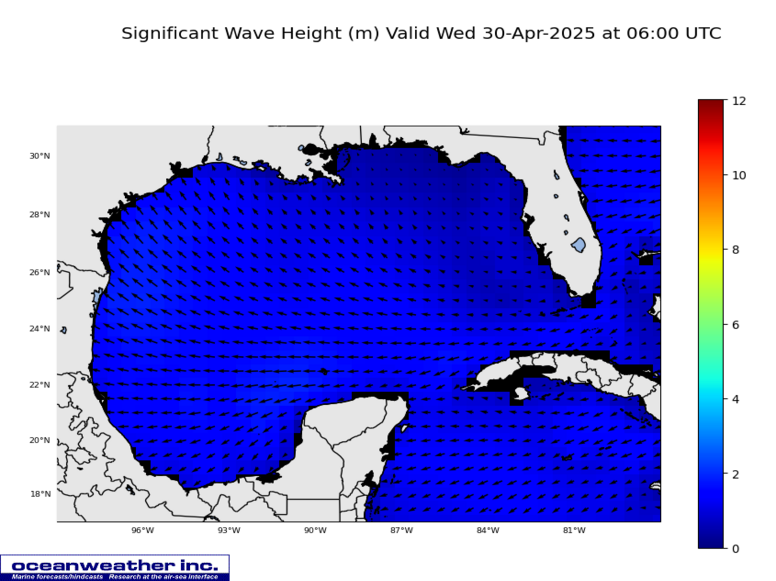
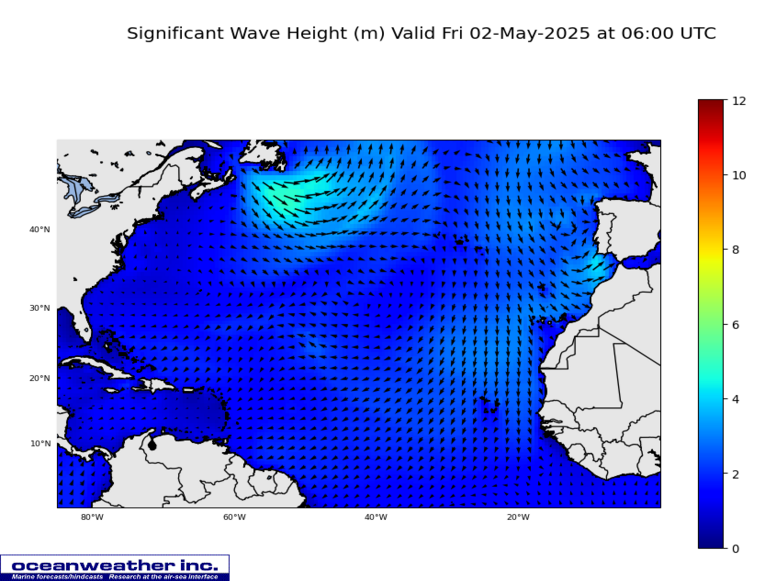
Wave Height
Wave Period
Gulf NDBC Buoy Locator
SE CONUS
Gulf of Mexico
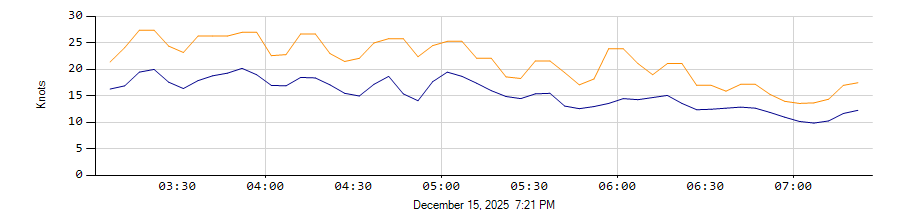
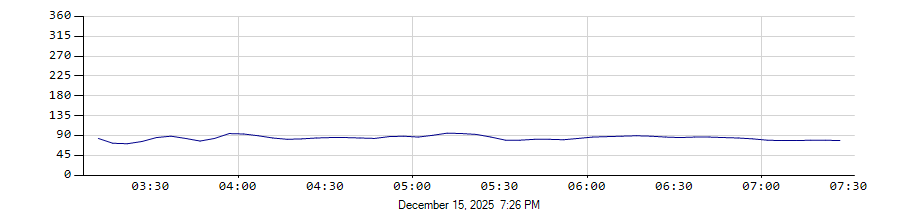
NDBC Buoy Observations
42001 - MID GULF, 180 nm South of Southwest Pass, LA
42036 - WEST TAMPA, 112 NM WNW of Tampa, FL
42040 - LUKE OFFSHORE TEST PLATFORM, 63 NM South of Dauphin Island, AL
42098 - EGMONT CHANNEL ENTRANCE, FL
42099 - OFFSHORE ST. PETERSBURG, FL
42039 - PENSACOLA, 115 NM SSE of Pensacola, FL
42012 - ORANGE BEACH, 44 NM SE of Mobile, AL
Sunrise/Sunset & Moon
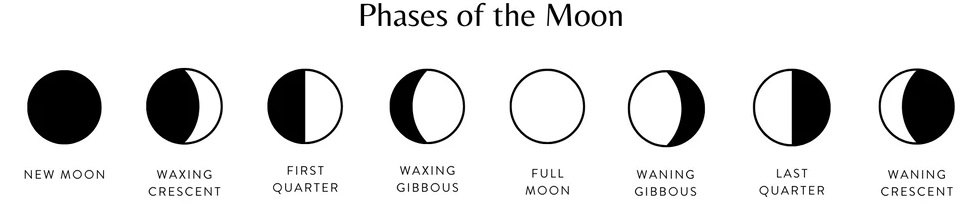
Loading current moon phase...
| Phase | Date | Time |
|---|---|---|
| Loading moon phase data... | ||
Tampa Bay CO-OPS Station Locator
DIYC
Downtown SW

Bayshore NE

SkyTower E

SkyTower W