San Diego Weather
Watches/Warnings
NHC is issuing advisories for Trudy and Simon

Loading active alerts map…
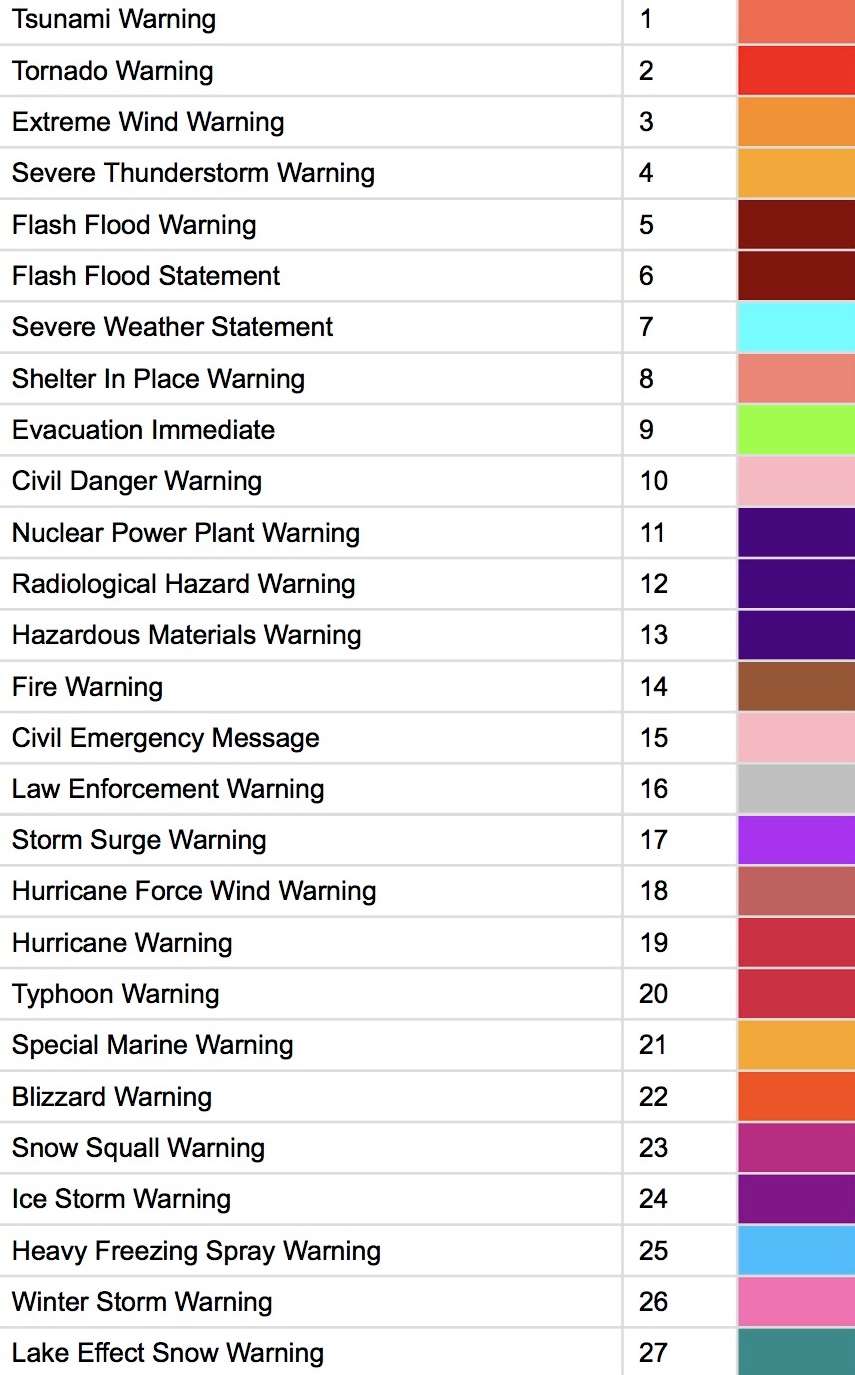
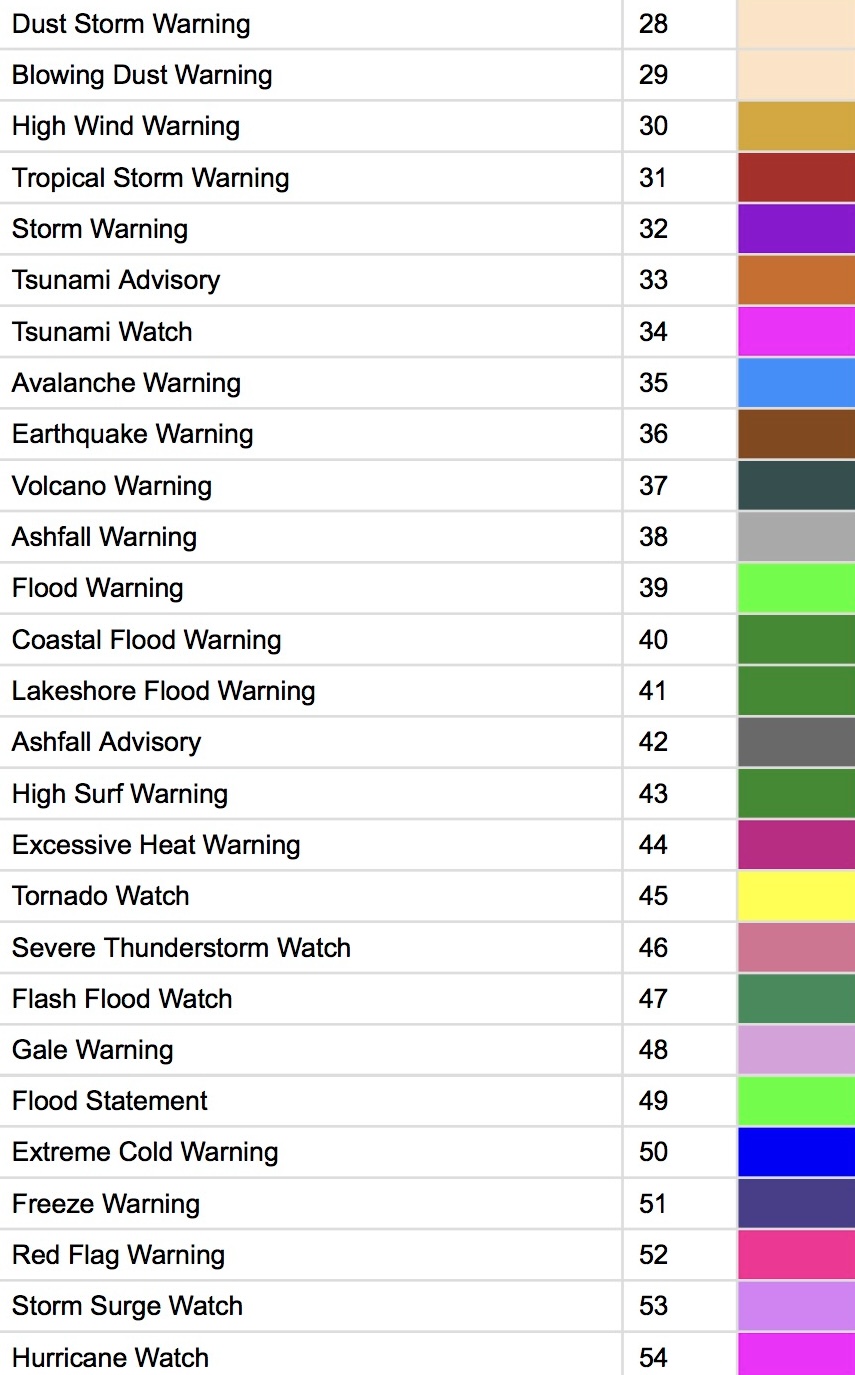
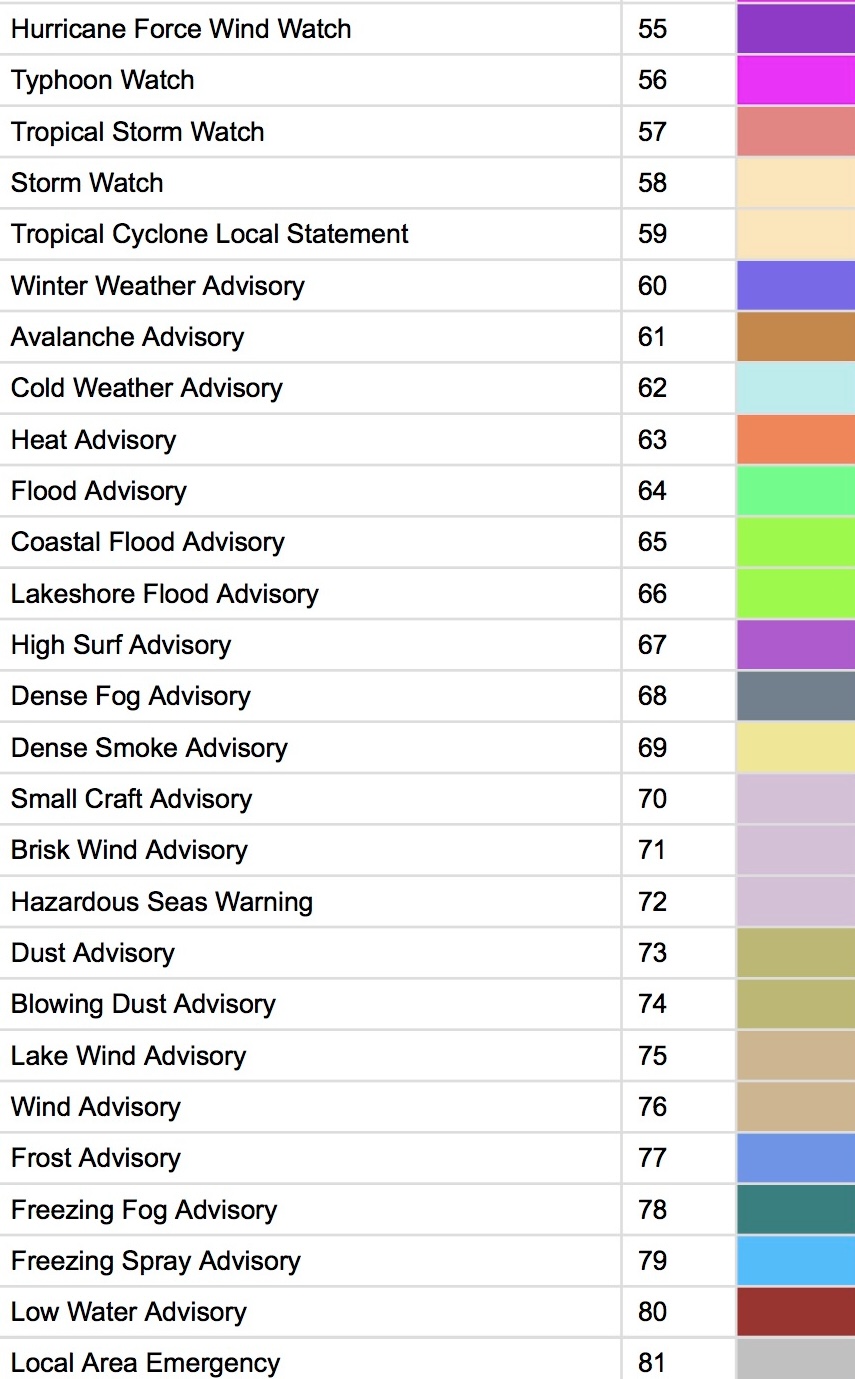
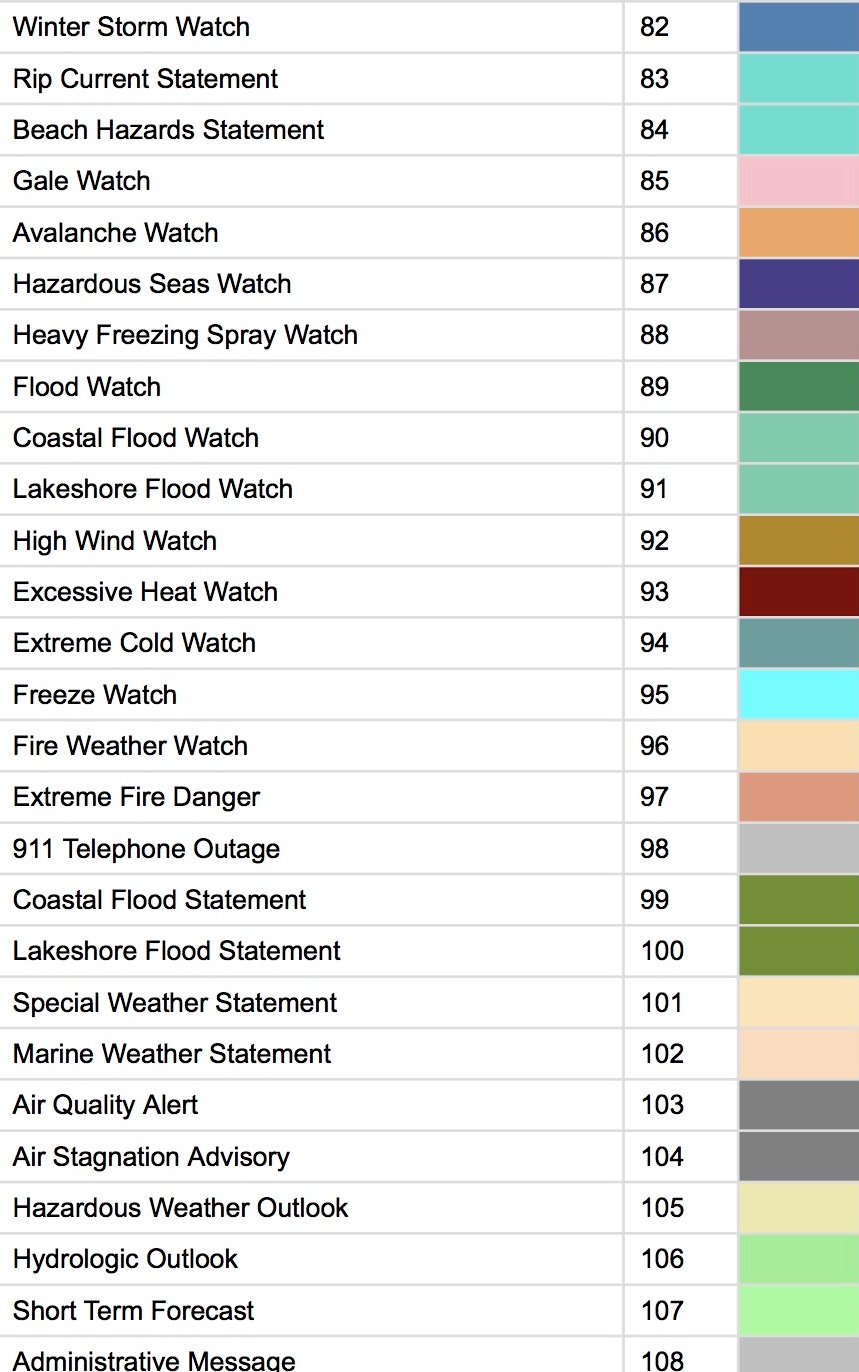
Current Watches, Warnings, and Alerts
Alert list is based on the visible map area. Loading the initial view…
Loading active alerts visible on the map…
Current 500 mb Chart
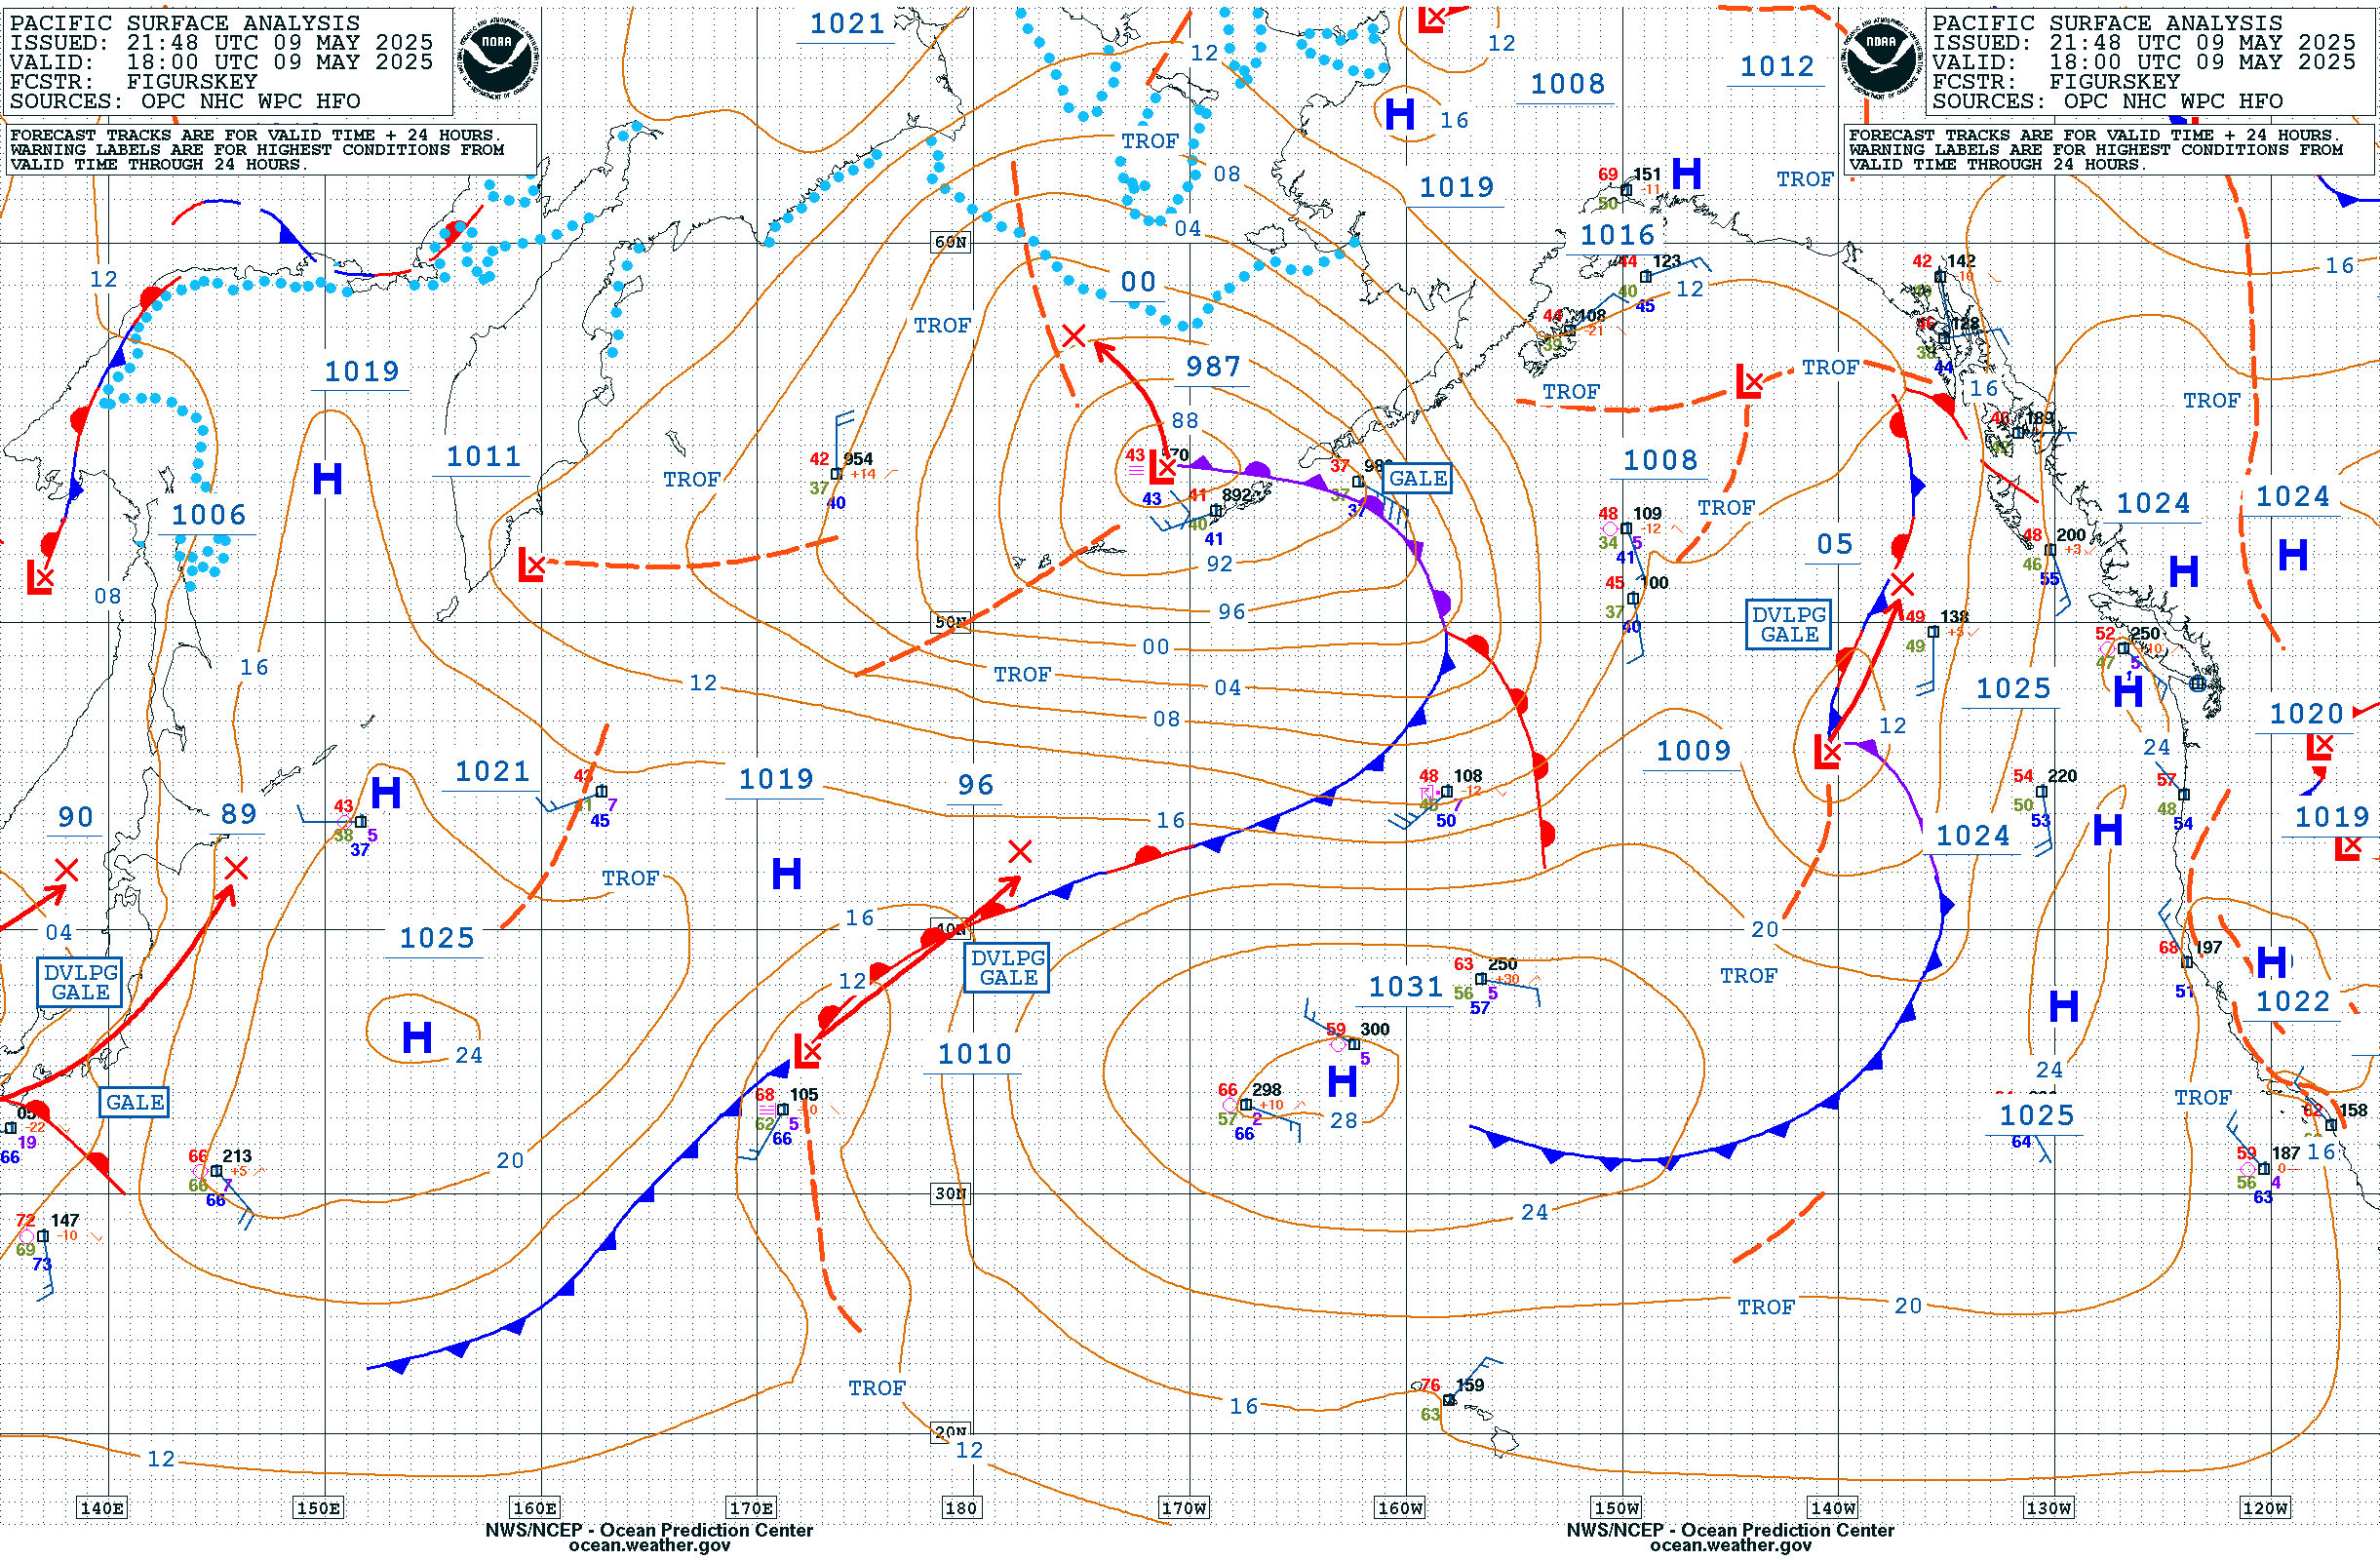
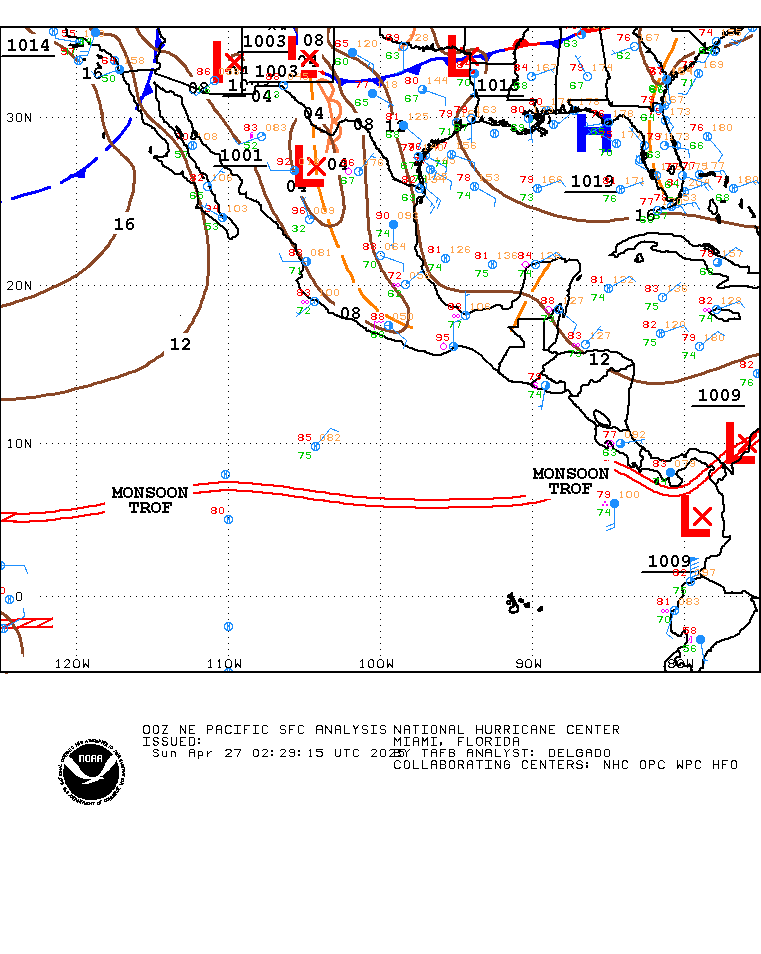
Current Surface Analysis
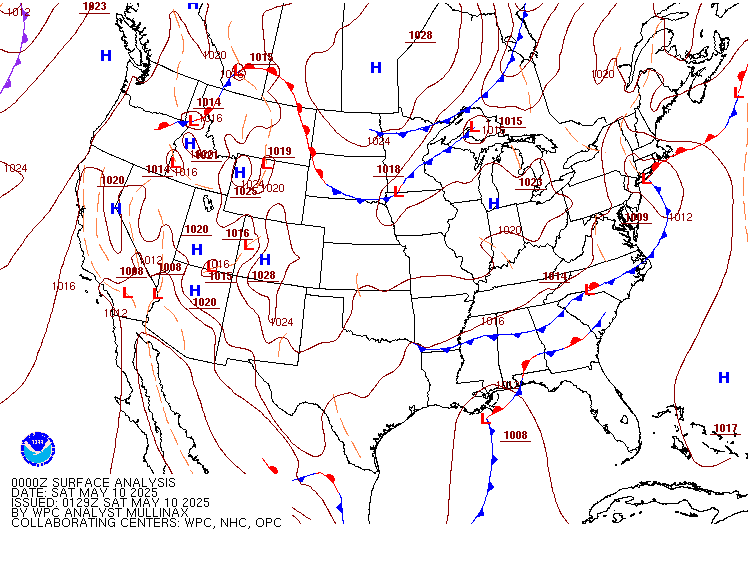
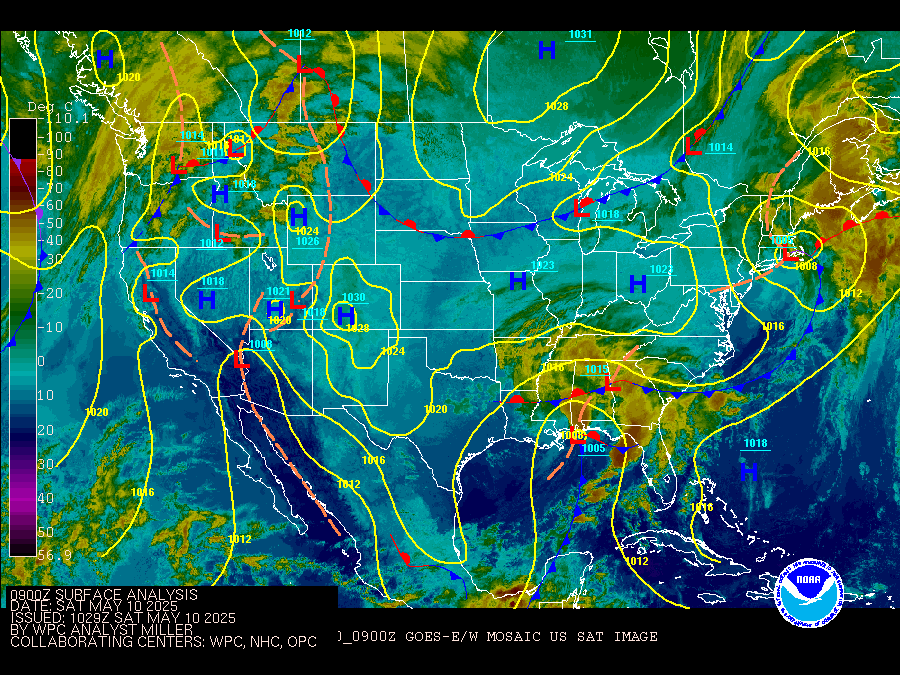
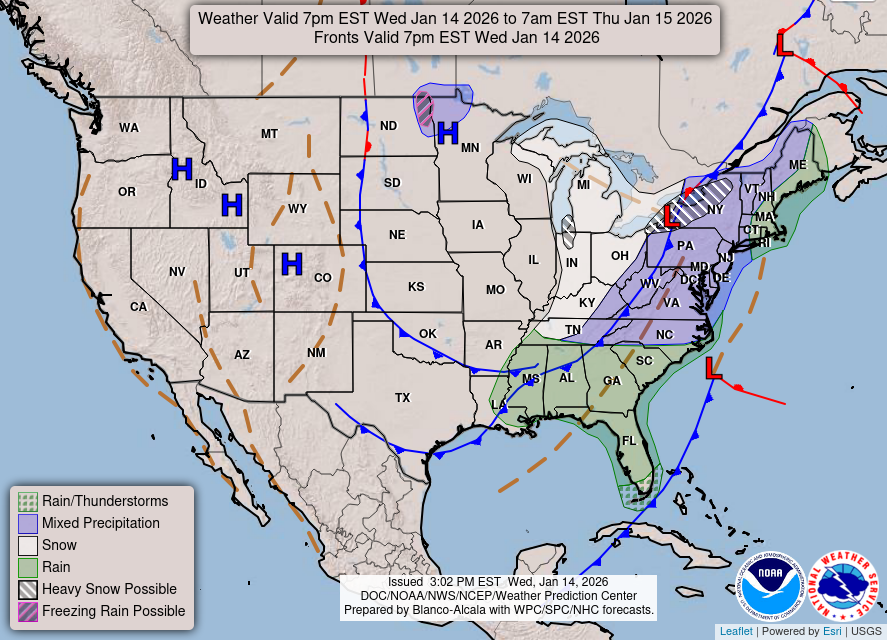
National Forecast Maps
Day 1
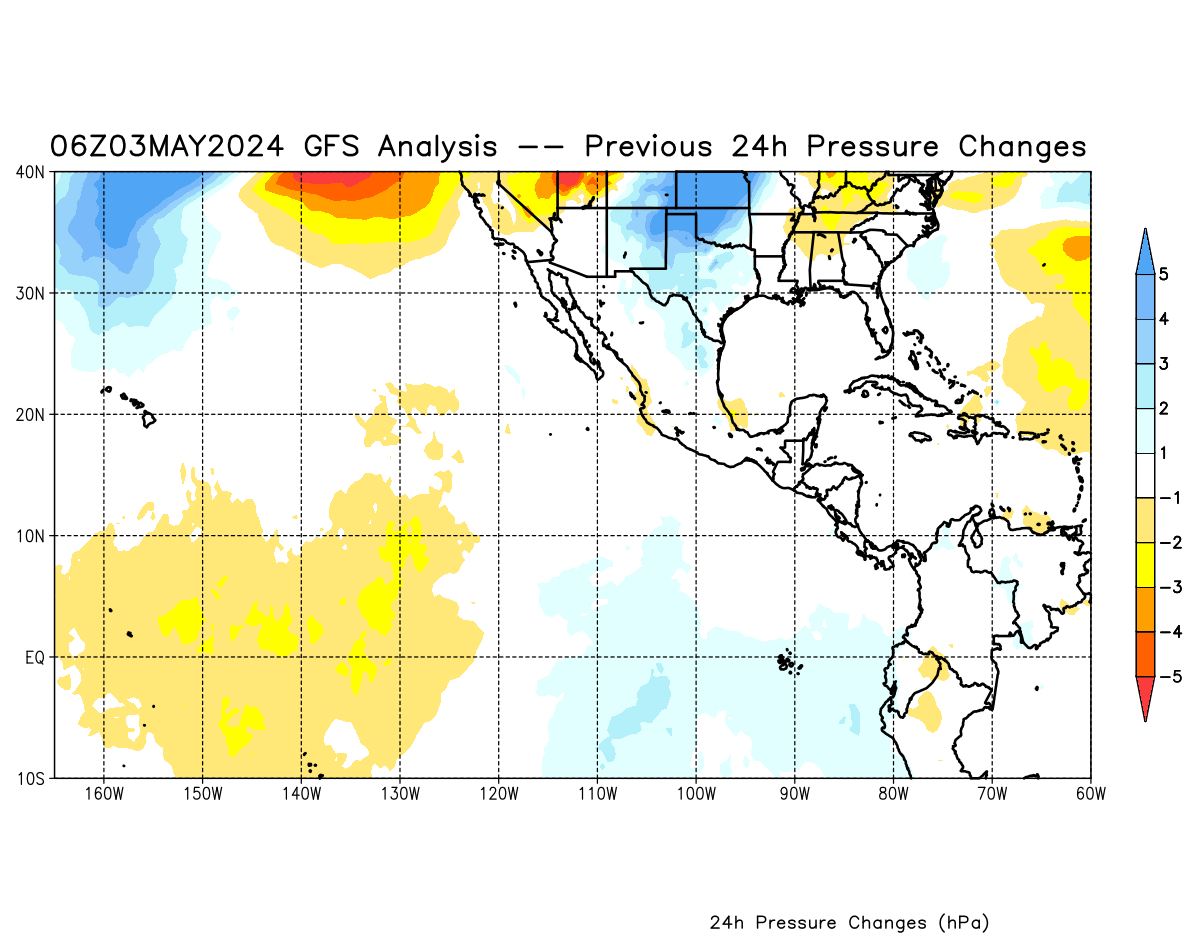
Pressure/Height Anomalies
MSLP

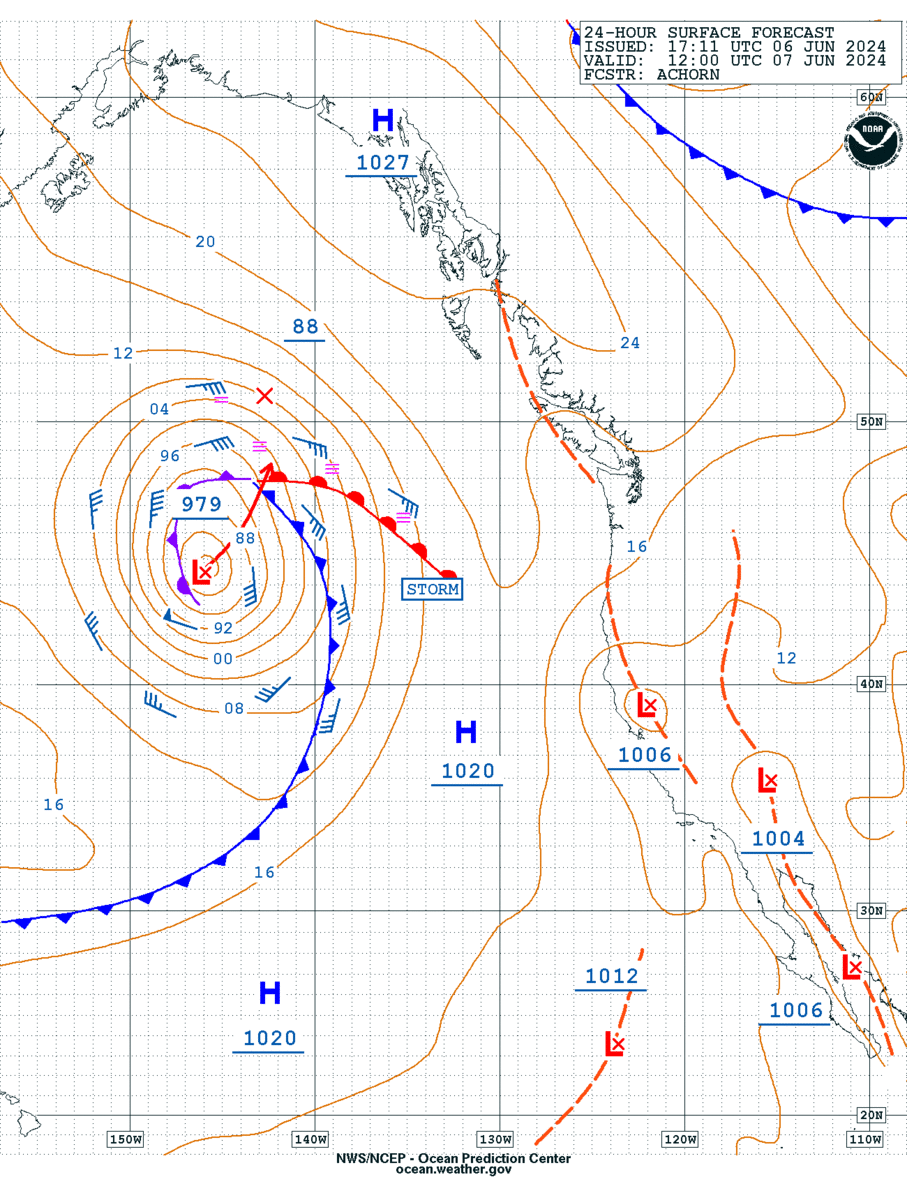
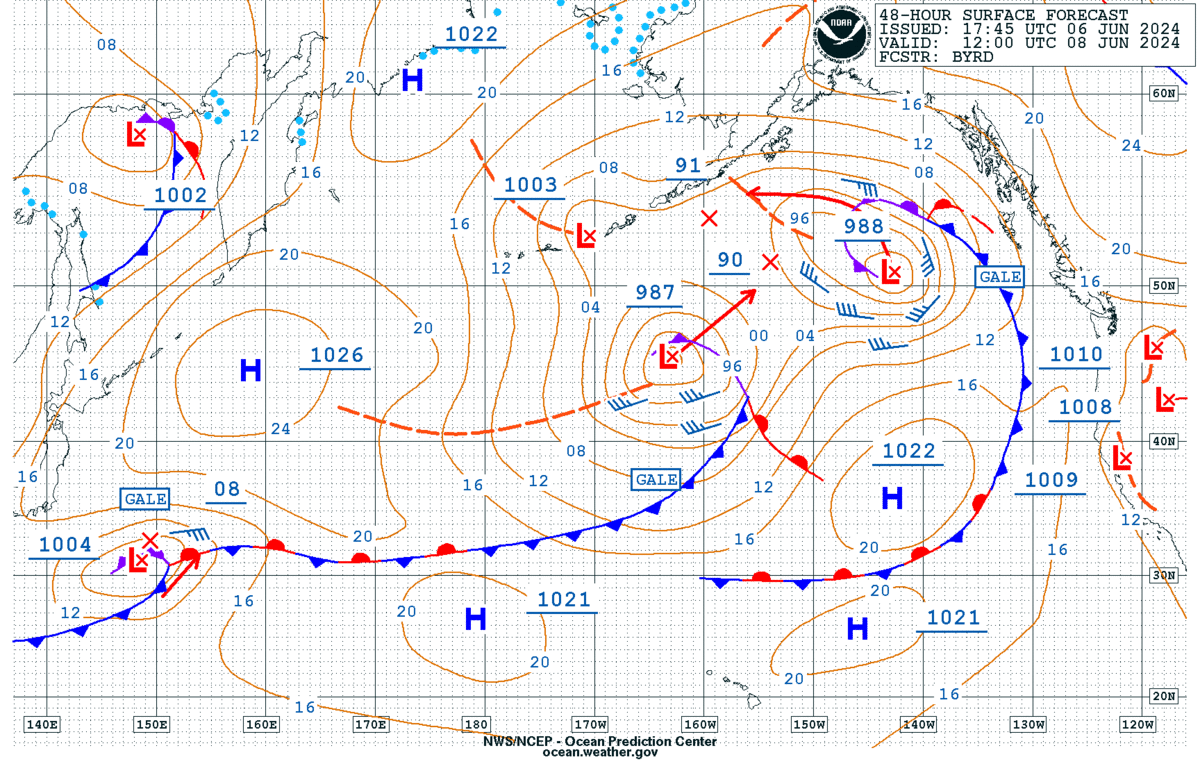
WPC Short-Term Prog Charts – Surface
6 Hr
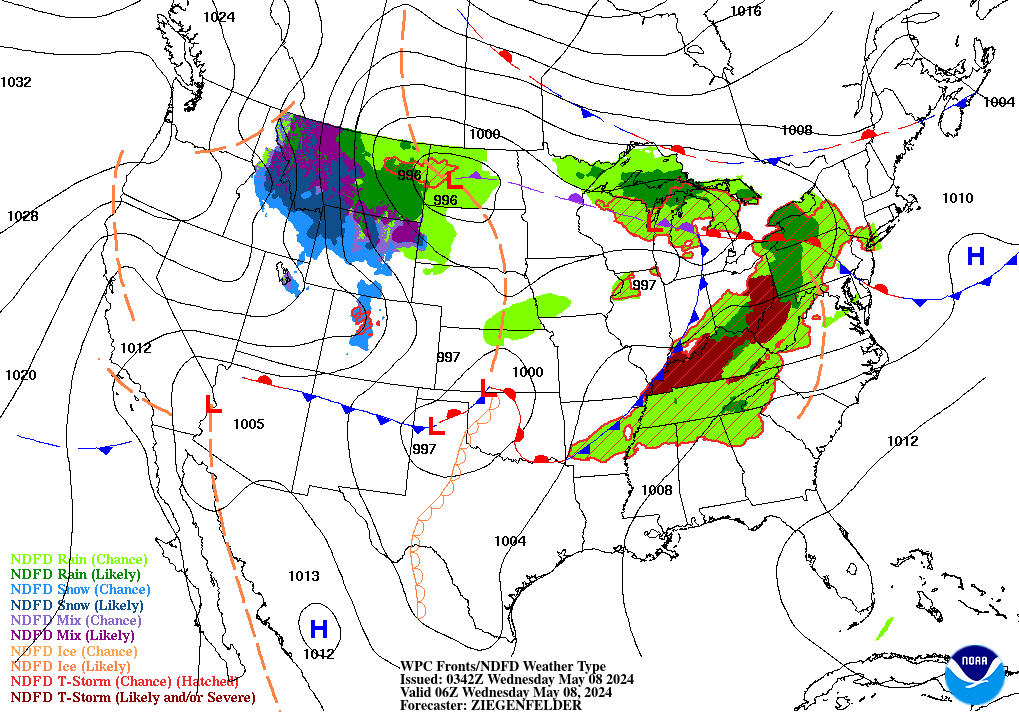
12 Hr
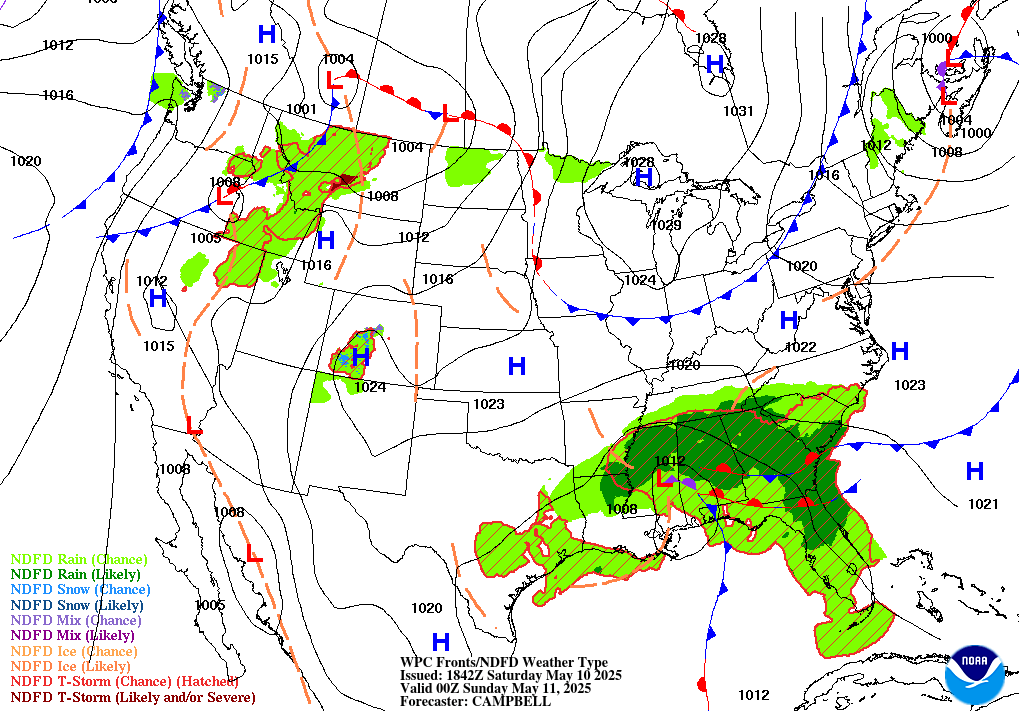
3 Hr

6 Hr

WPC Short Term Forecast
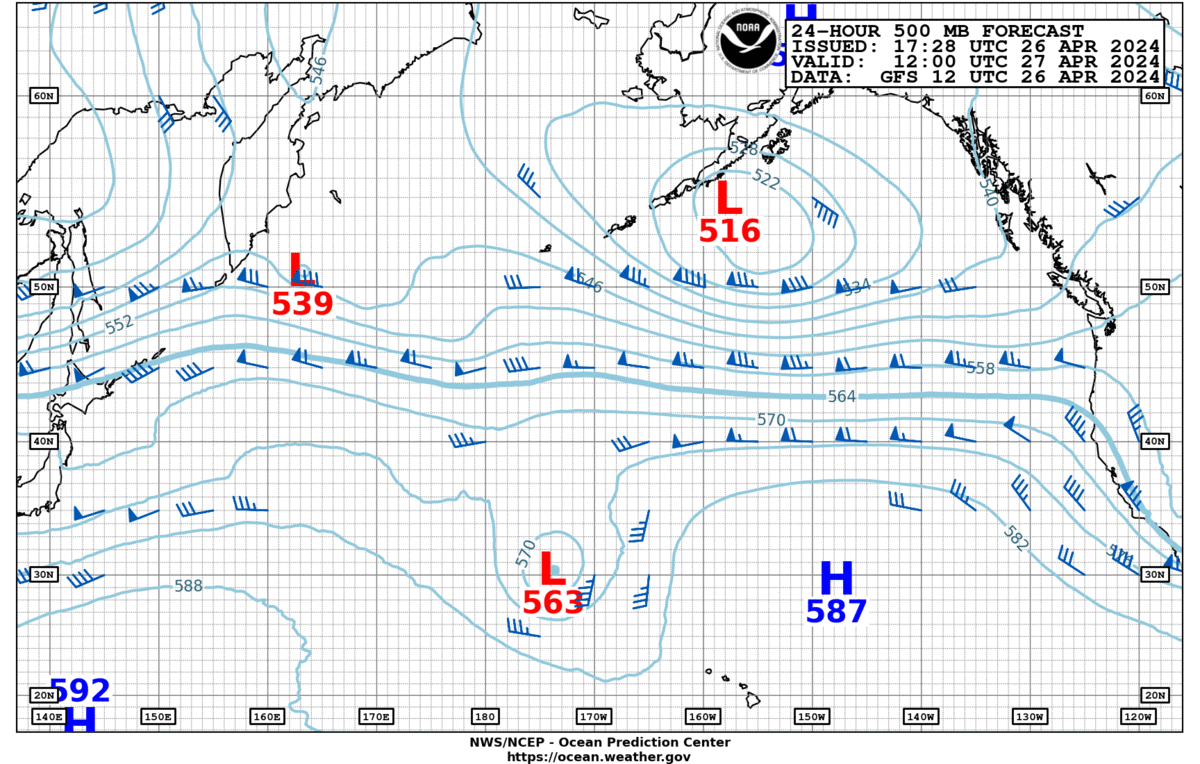
WPC Prog Charts – 500mb
Day 3
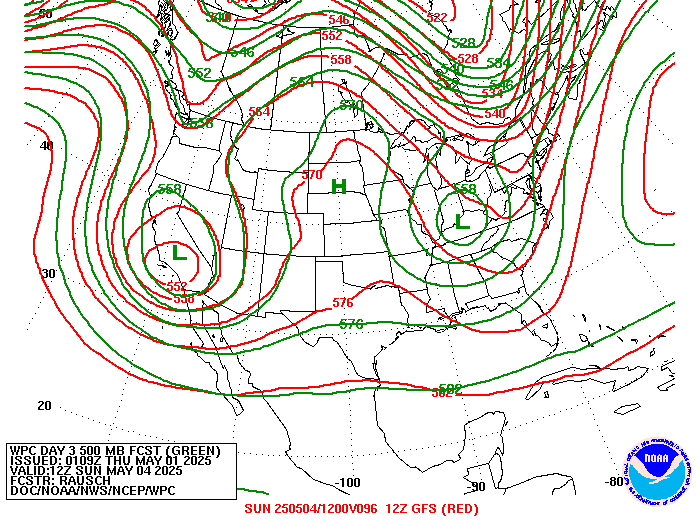
24 Hr


Current Warnings/Watches & Discussions
Loading SPC/WPC discussion map…
San Diego Area Forecast Discussion


Relative 700-300mb Relative Humidity
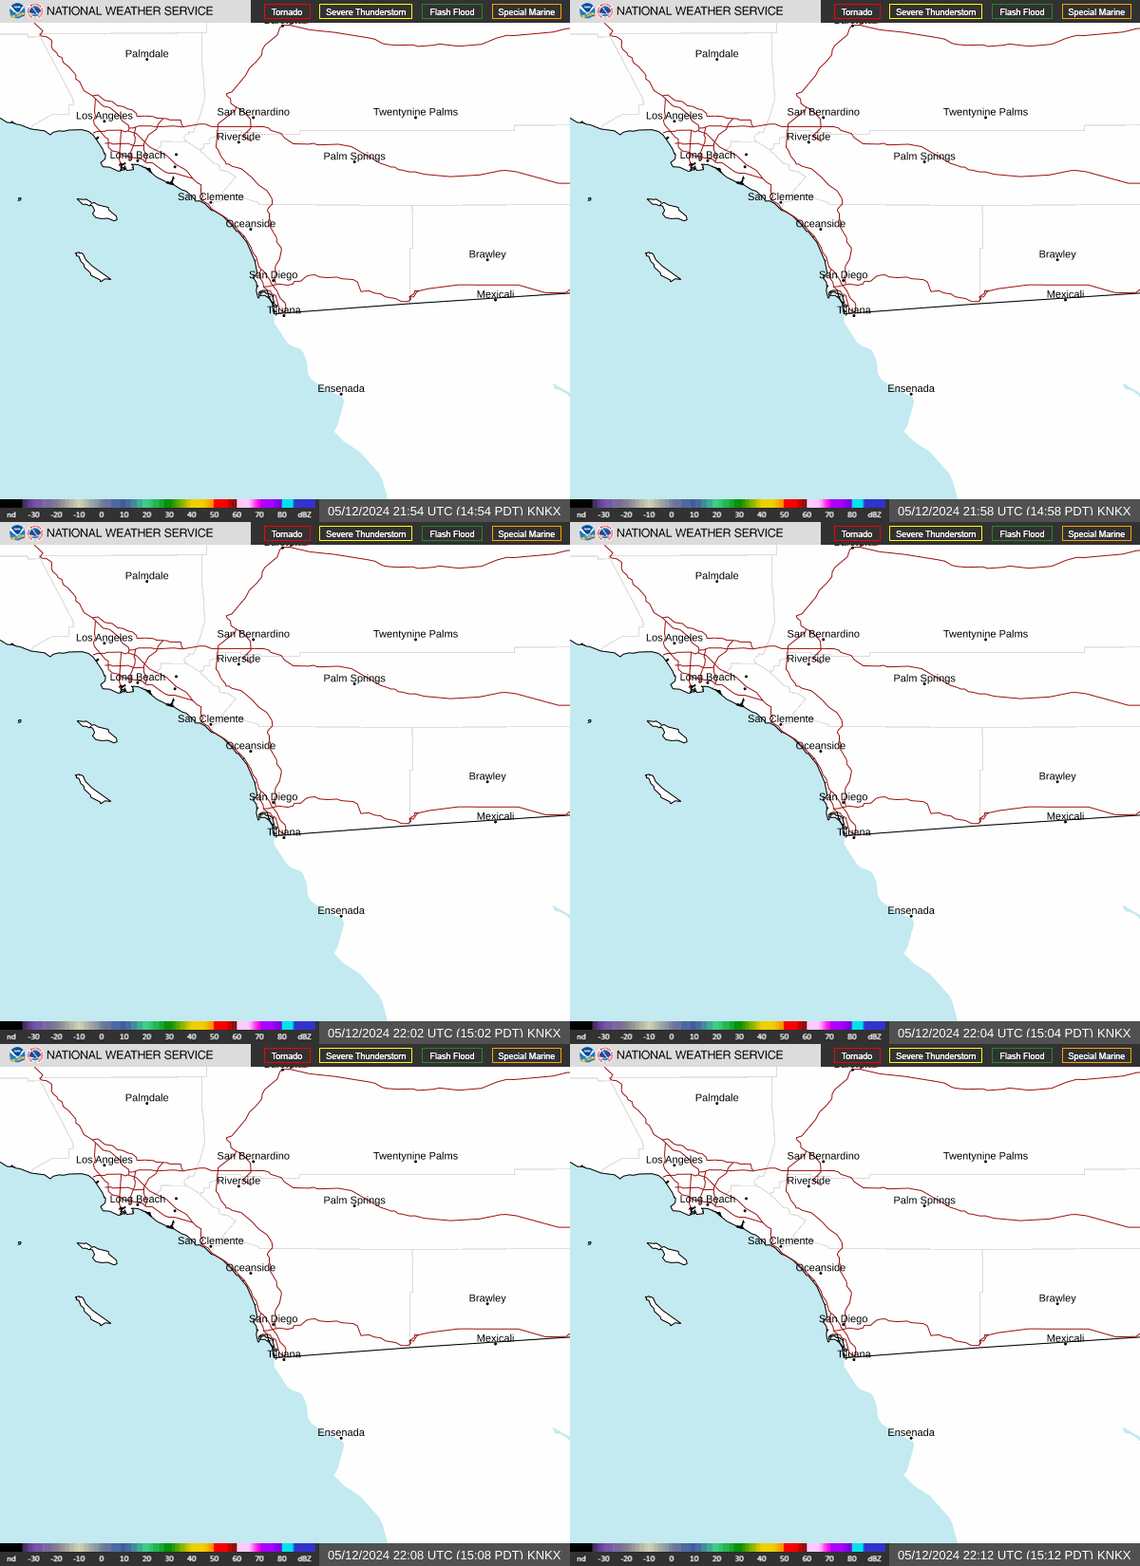
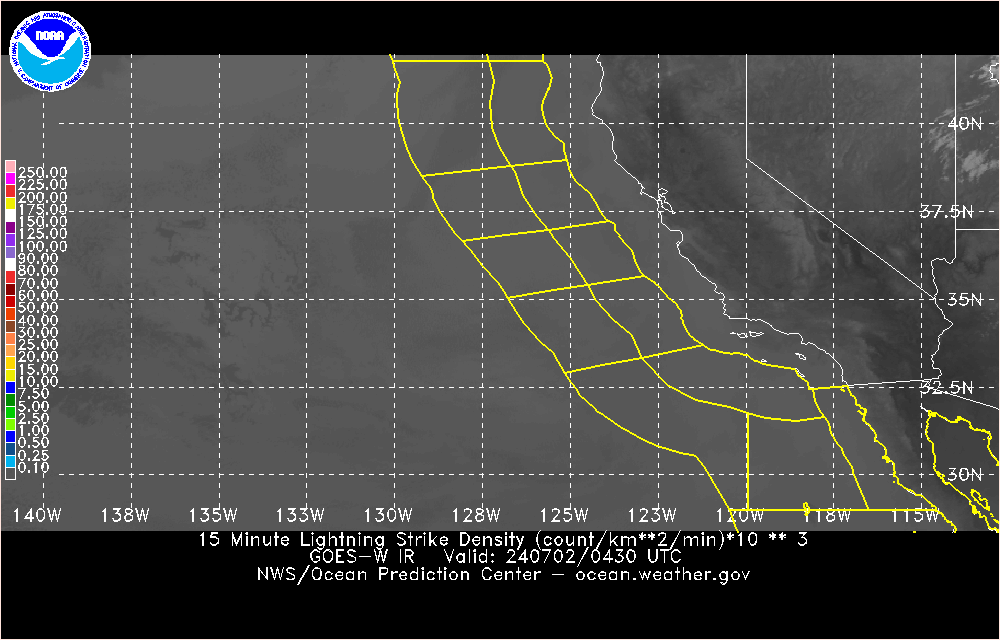
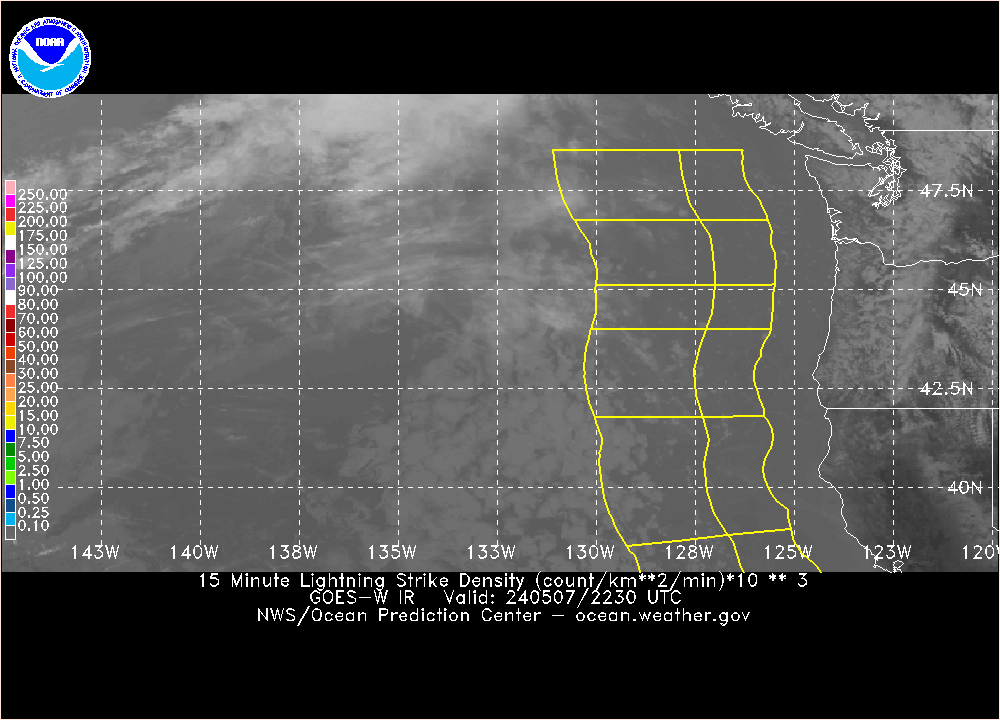
Latest Local METARS

Western U.S. Models
Current Model MSLP & 10m Wind
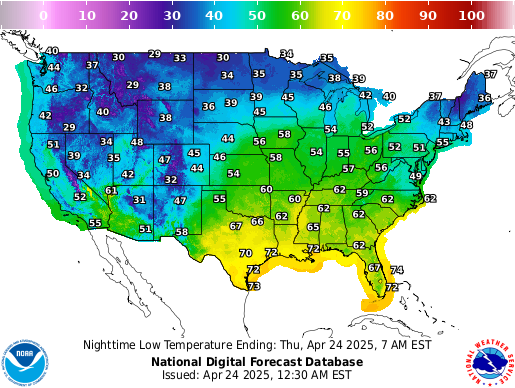
Temperatures
Day 1
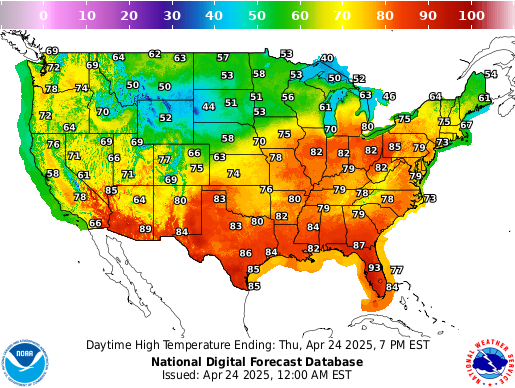
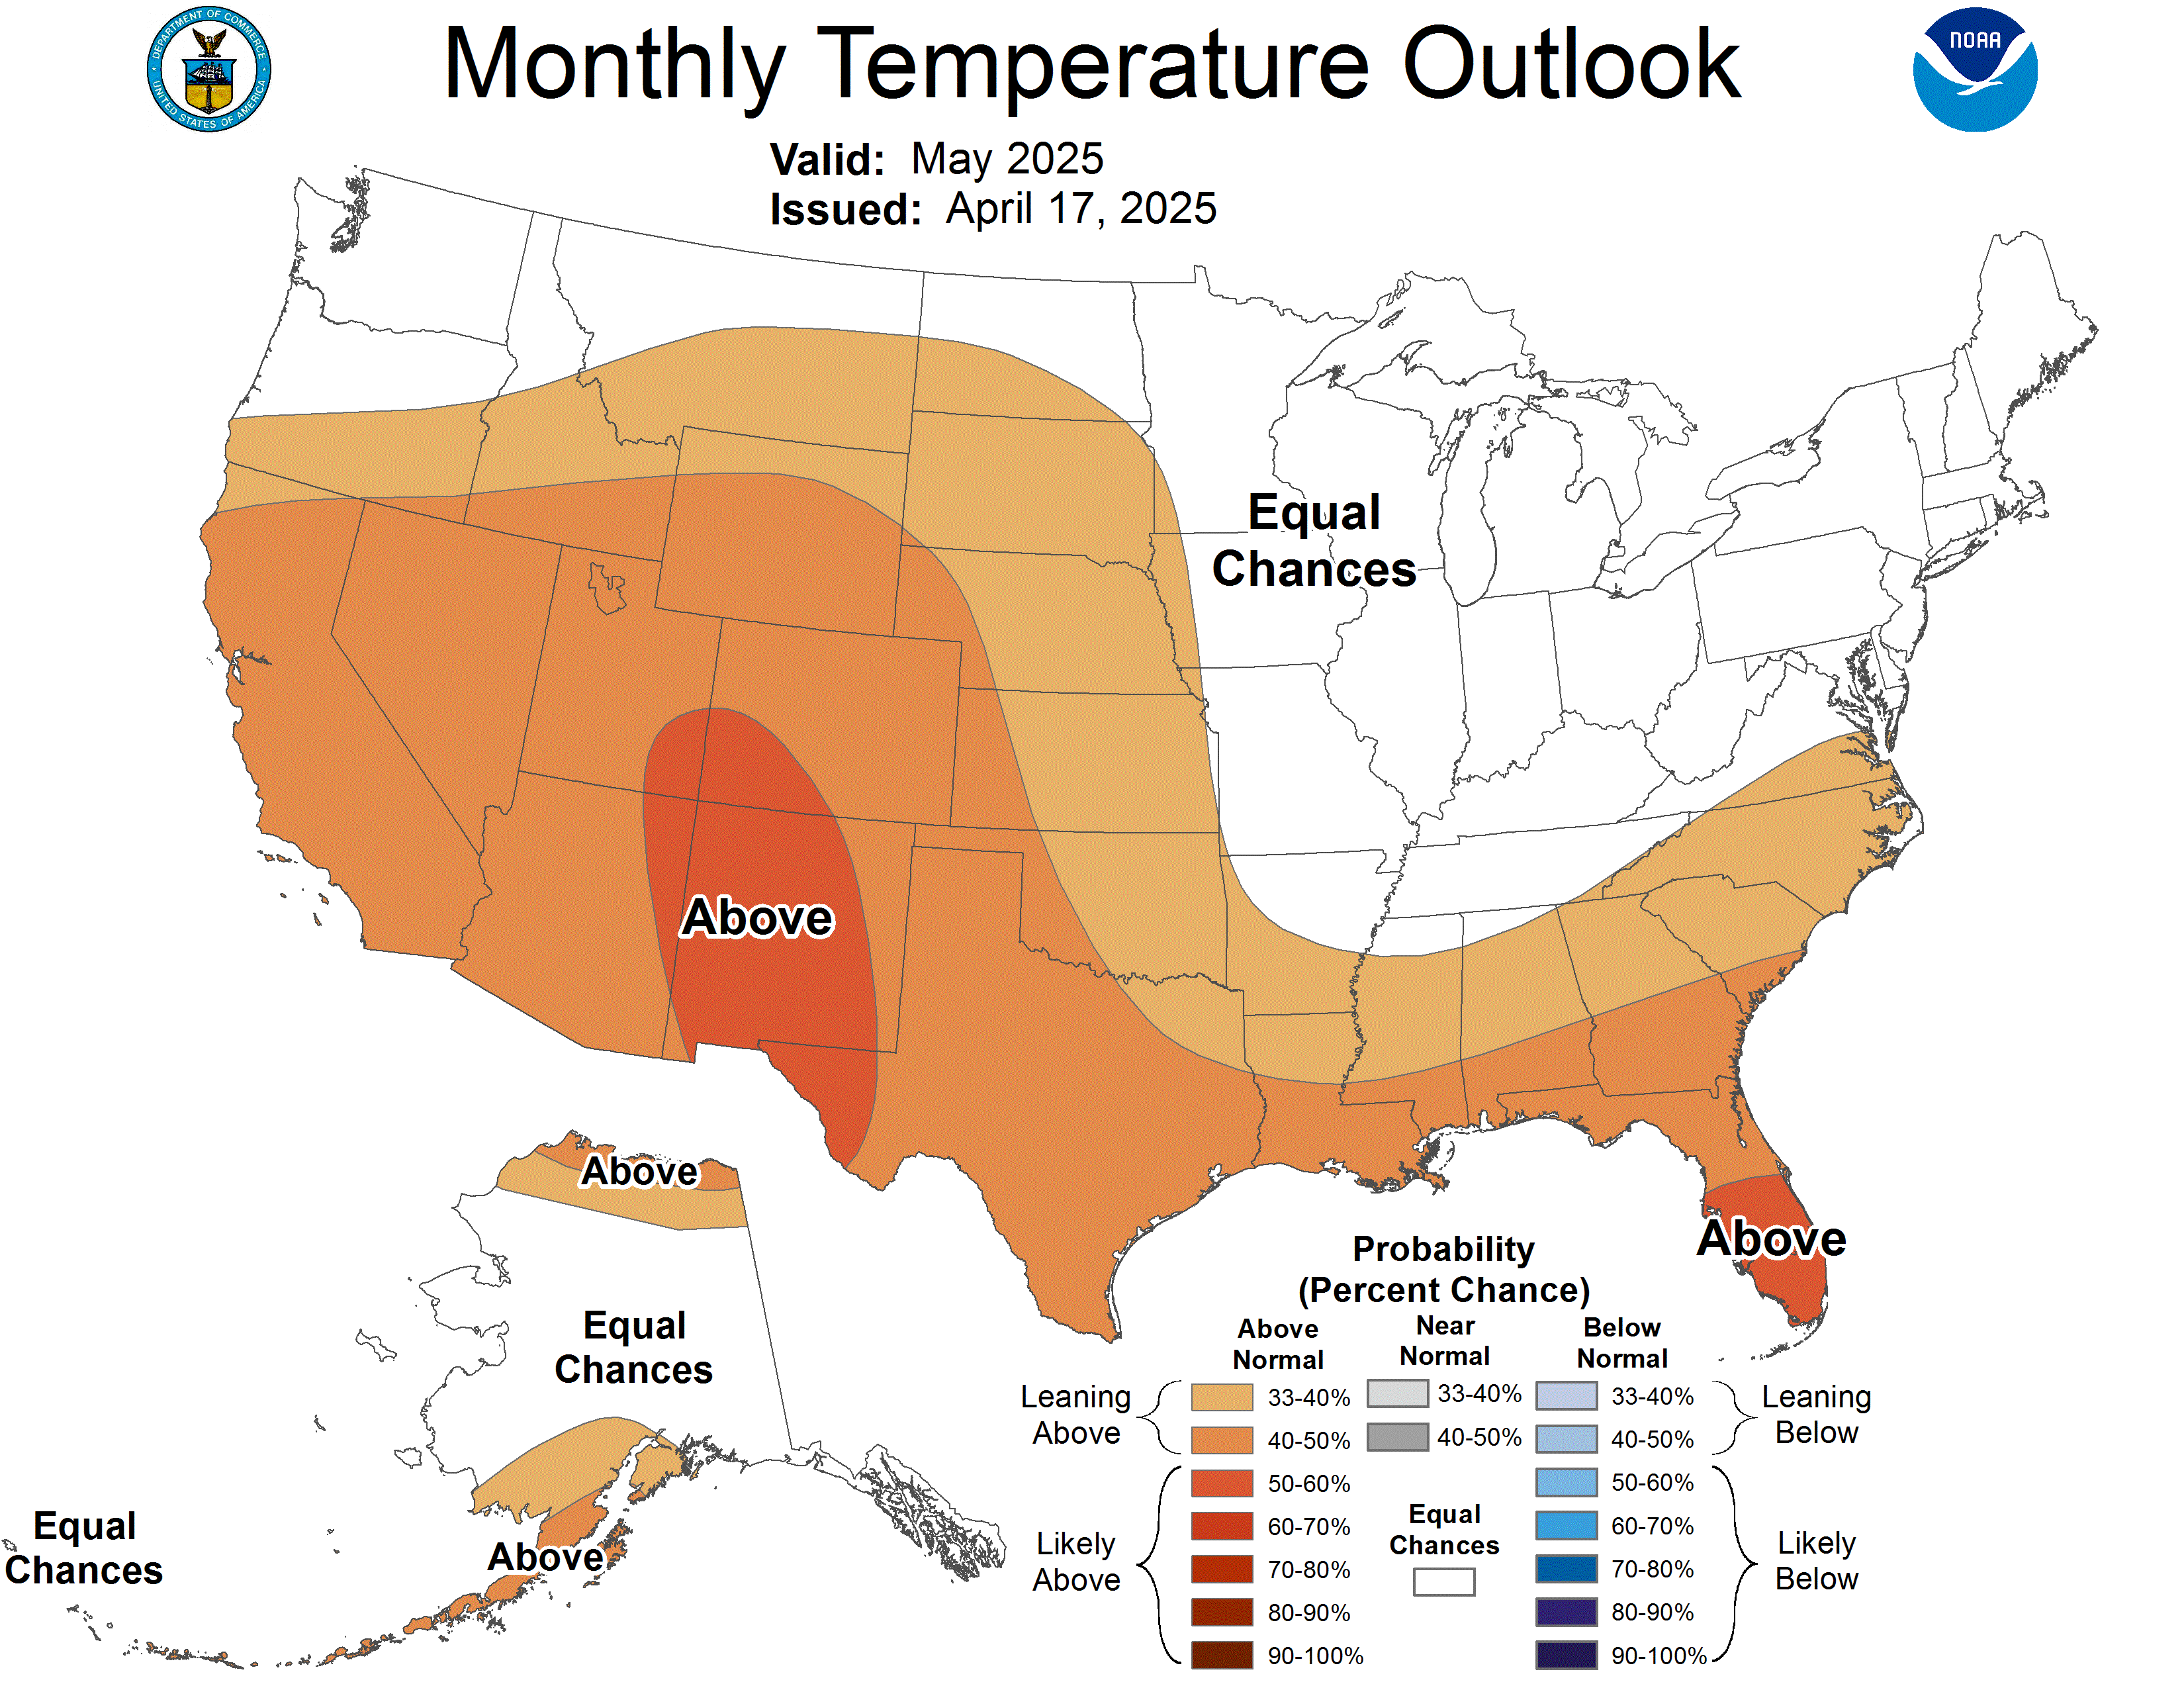
Monthly Temperature Outlook
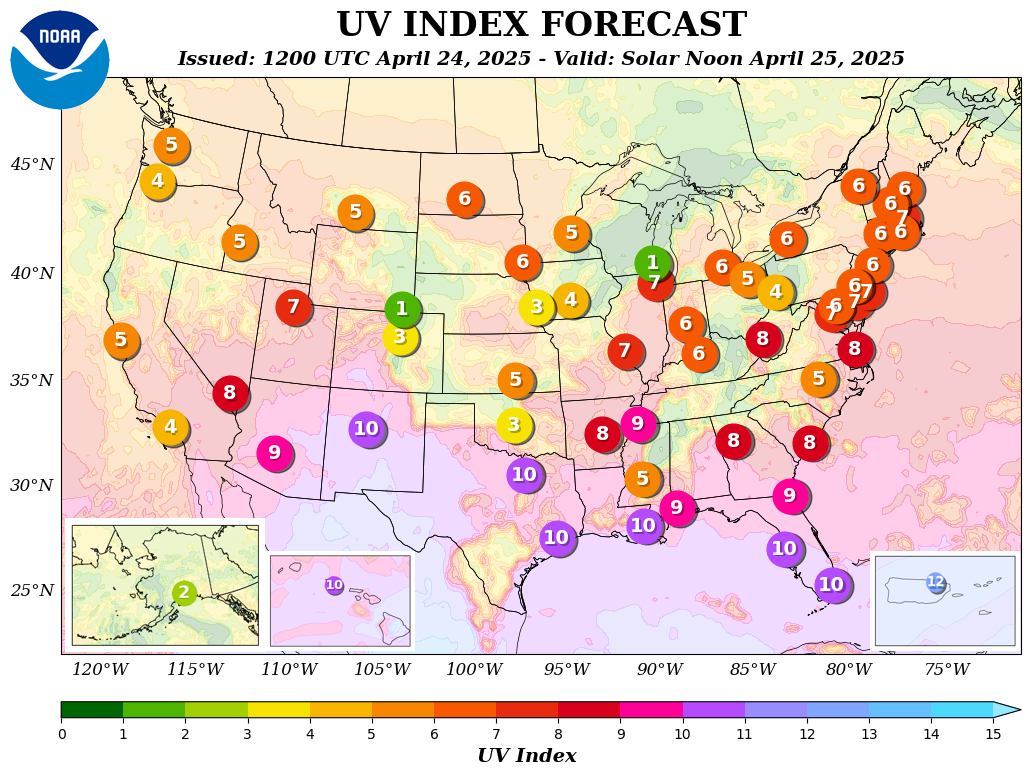
UV Index
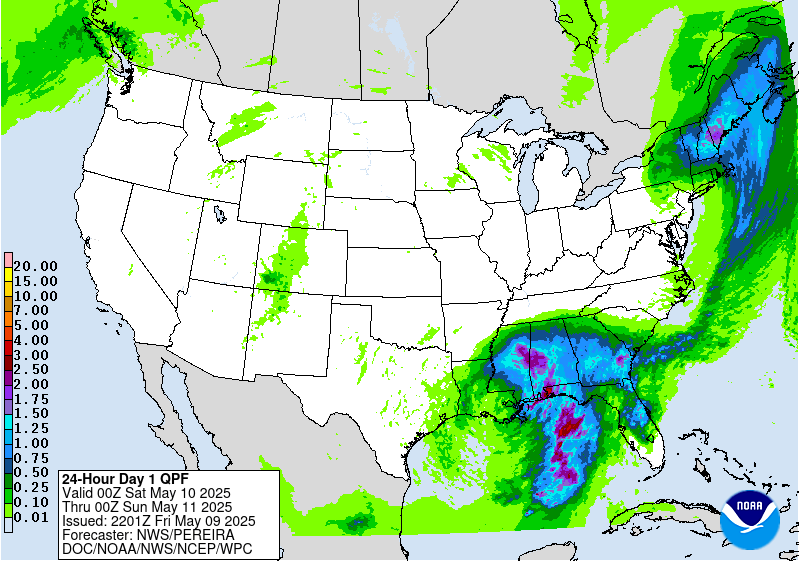
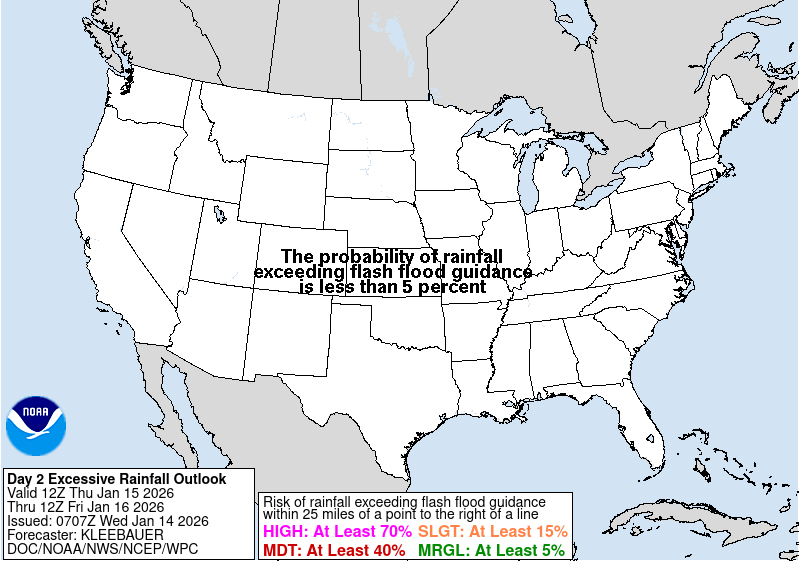
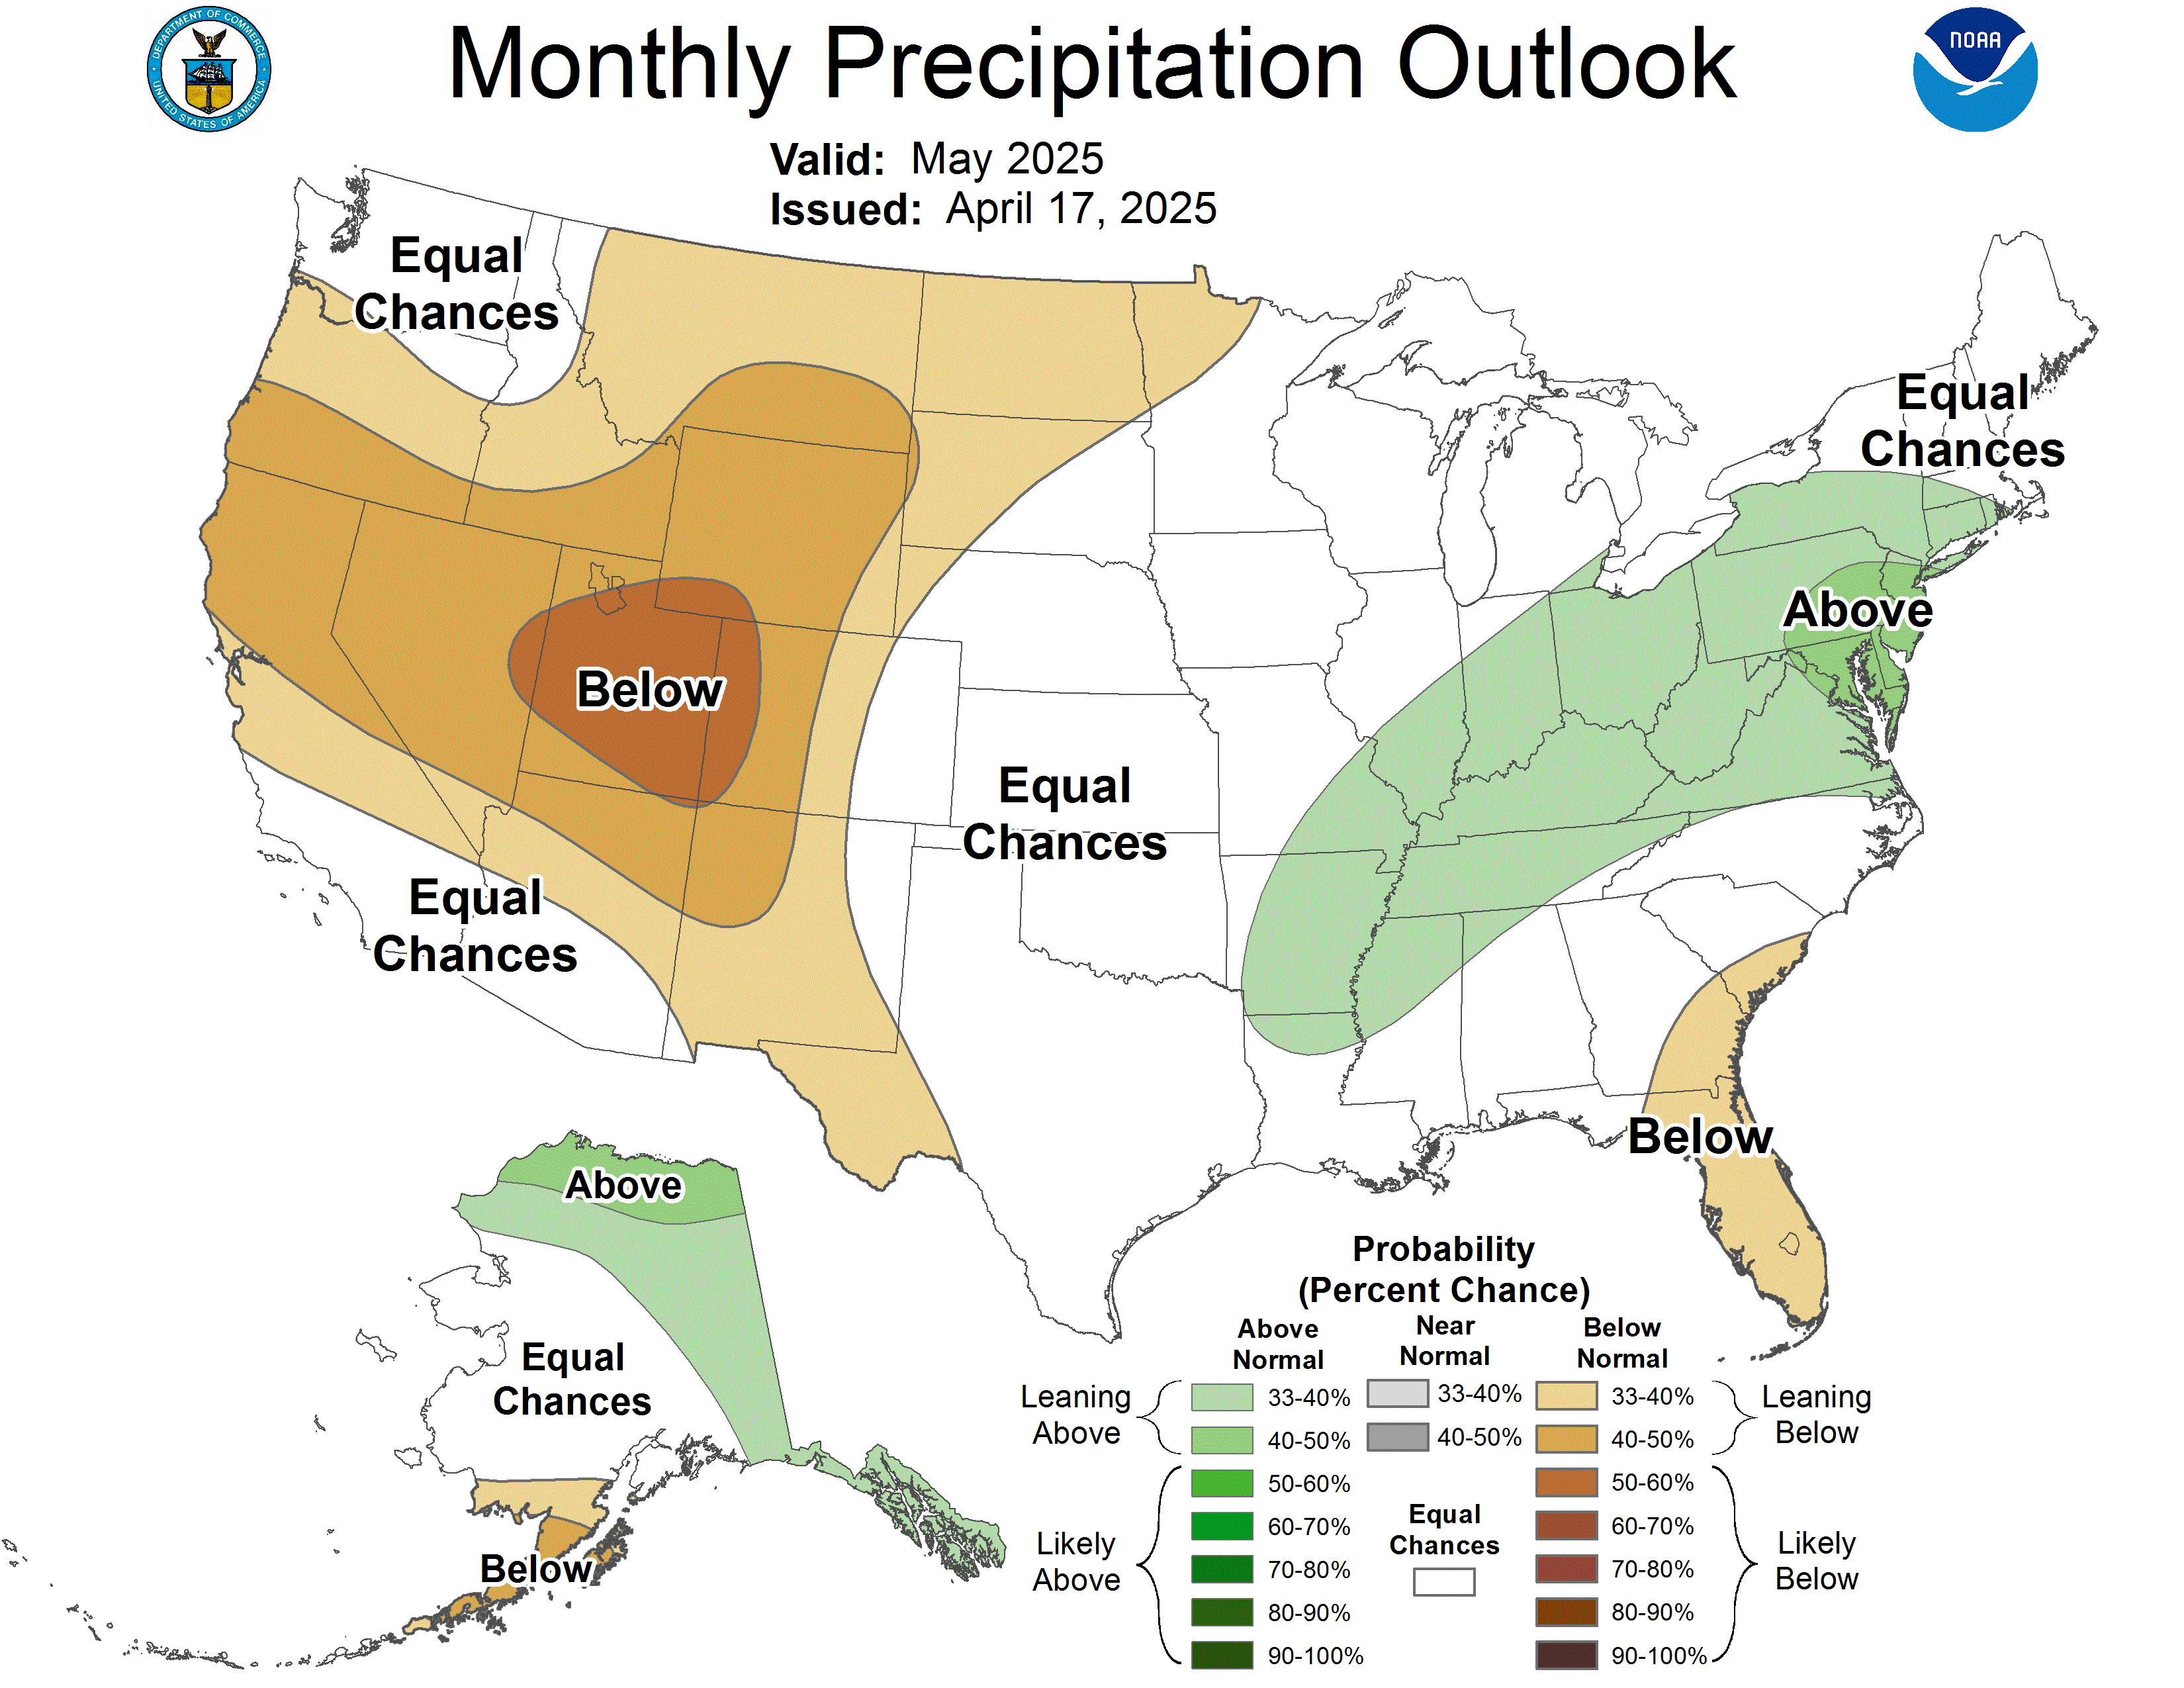
Rain
Day 1
Day 2
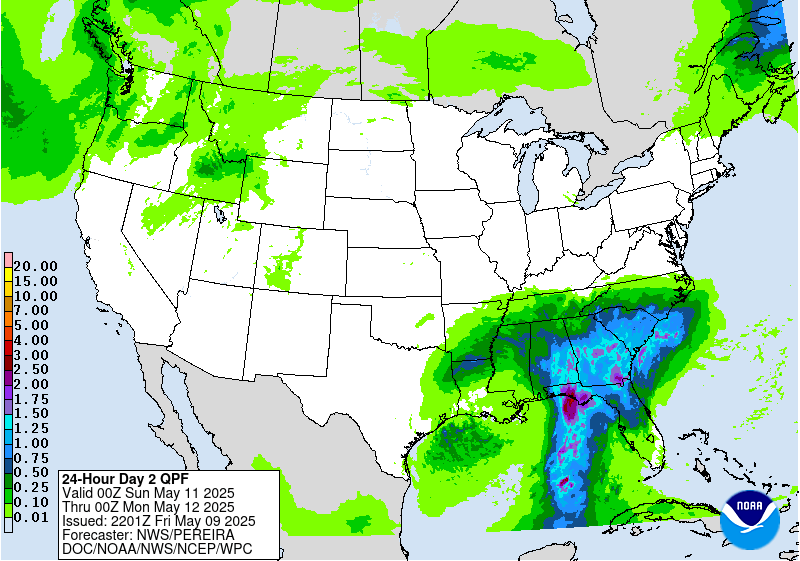
Day 1
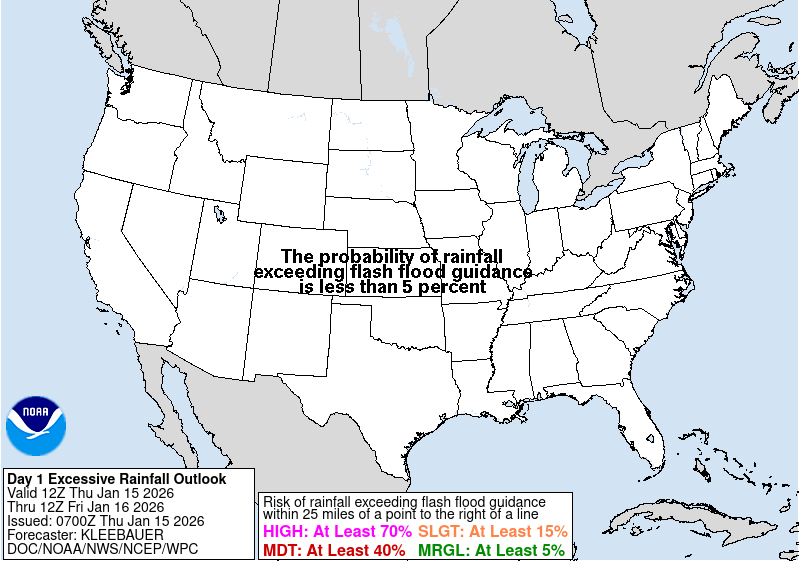
Day 2
Monthly Precipitation Outlook
Monitor
Atmospheric Sounding

Skew-T Diagram Cheat Sheet
1. Axes and Basic Layout
- X-Axis (Bottom): Temperature in °C (skewed right with height)
- Y-Axis (Left): Pressure in hPa (logarithmic scale)
- Isobars: Horizontal constant pressure lines (e.g., 1000, 850, 700, 500, 300 hPa)
- Isotherms: Diagonal lines (skewed right); constant temperature
- Dry Adiabats: Curved, upward-right; dry parcel ascent path
- Moist Adiabats: Curved, upward-left; saturated parcel ascent path
- Mixing Ratio Lines: Dashed, upward-right; constant dew point depression
2. Key Plotted Lines
- Environmental Temperature: Red or black solid line (actual air temperature)
- Dew Point Temperature: Green or blue solid line (moisture profile)
- Parcel Ascent Line: Usually yellow or dashed; follows adiabats for lifted parcel
3. Wind Barbs (Right Margin)
- Full barb: 10 knots
- Half barb: 5 knots
- Pennant (flag): 50 knots
- Direction: Where wind is coming from
4. Important Atmospheric Features
| Feature | Interpretation |
|---|---|
| LCL (Lifting Condensation Level) | Cloud base; where T and Td converge |
| LFC (Level of Free Convection) | Parcel rises freely; indicates instability |
| EL (Equilibrium Level) | Parcel cools below environment; near cloud top |
| CAPE | Positive energy; >1000 J/kg = storms; >2500 = strong storms |
| CIN | Negative energy; CIN > 50 J/kg may suppress convection |
| Inversion | Temp increases with height; suppresses convection |
| Dry Layer | Large T-Td difference; limits clouds/enhances downdrafts |
| Moist Layer | Small T-Td difference; promotes fog/clouds near surface |
5. Rule-of-Thumb Values
Instability – CAPE
| CAPE | Interpretation |
|---|---|
| 0–500 J/kg | Stable / weak convection |
| 500–1000 | Marginal instability |
| 1000–2500 | Moderate instability |
| 2500–3500 | Strong instability |
| >3500 | Extreme (severe storm potential) |
Wind Shear (0–6 km Bulk Shear)
- <20 kt: Weak shear – pulse storms
- 20–35 kt: Moderate shear – organized storms possible
- >35 kt: Strong shear – supercells/severe potential
Lapse Rate (700–500 hPa)
- >6.5°C/km: Steep lapse rate = more instability
- <6.0°C/km: Stable or neutral layer
6. Specialized Indicators
| Indicator | What to Watch For |
|---|---|
| Veering Winds | Clockwise with height; warm-air advection |
| Backing Winds | Counterclockwise; cold-air advection |
| Critical Thickness (~540 dam) | Useful for winter snow prediction |
| Dry Slot | Mid-level dry air; evaporation/microburst risk |
7. Example Scenarios
Thunderstorm Likely
- CAPE > 1000 J/kg
- LCL < 1500 m
- LFC present
- Wind shear > 20 kt
- CIN < 25 J/kg
Fog Formation
- Surface T ≈ Td
- Saturated boundary layer
- Light/calm winds
- Surface inversion
Supercell Environment
- CAPE > 2000
- Shear > 40 kt
- High lapse rates
- Veering winds with height
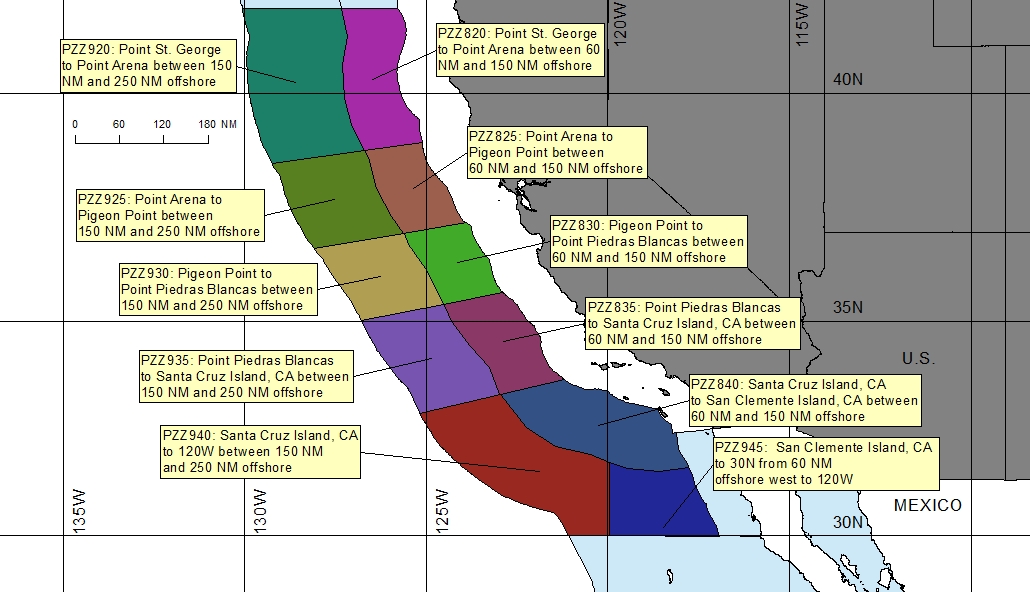
Marine Forecasts
Coastal Forecast

Offshore Forecast – California Waters
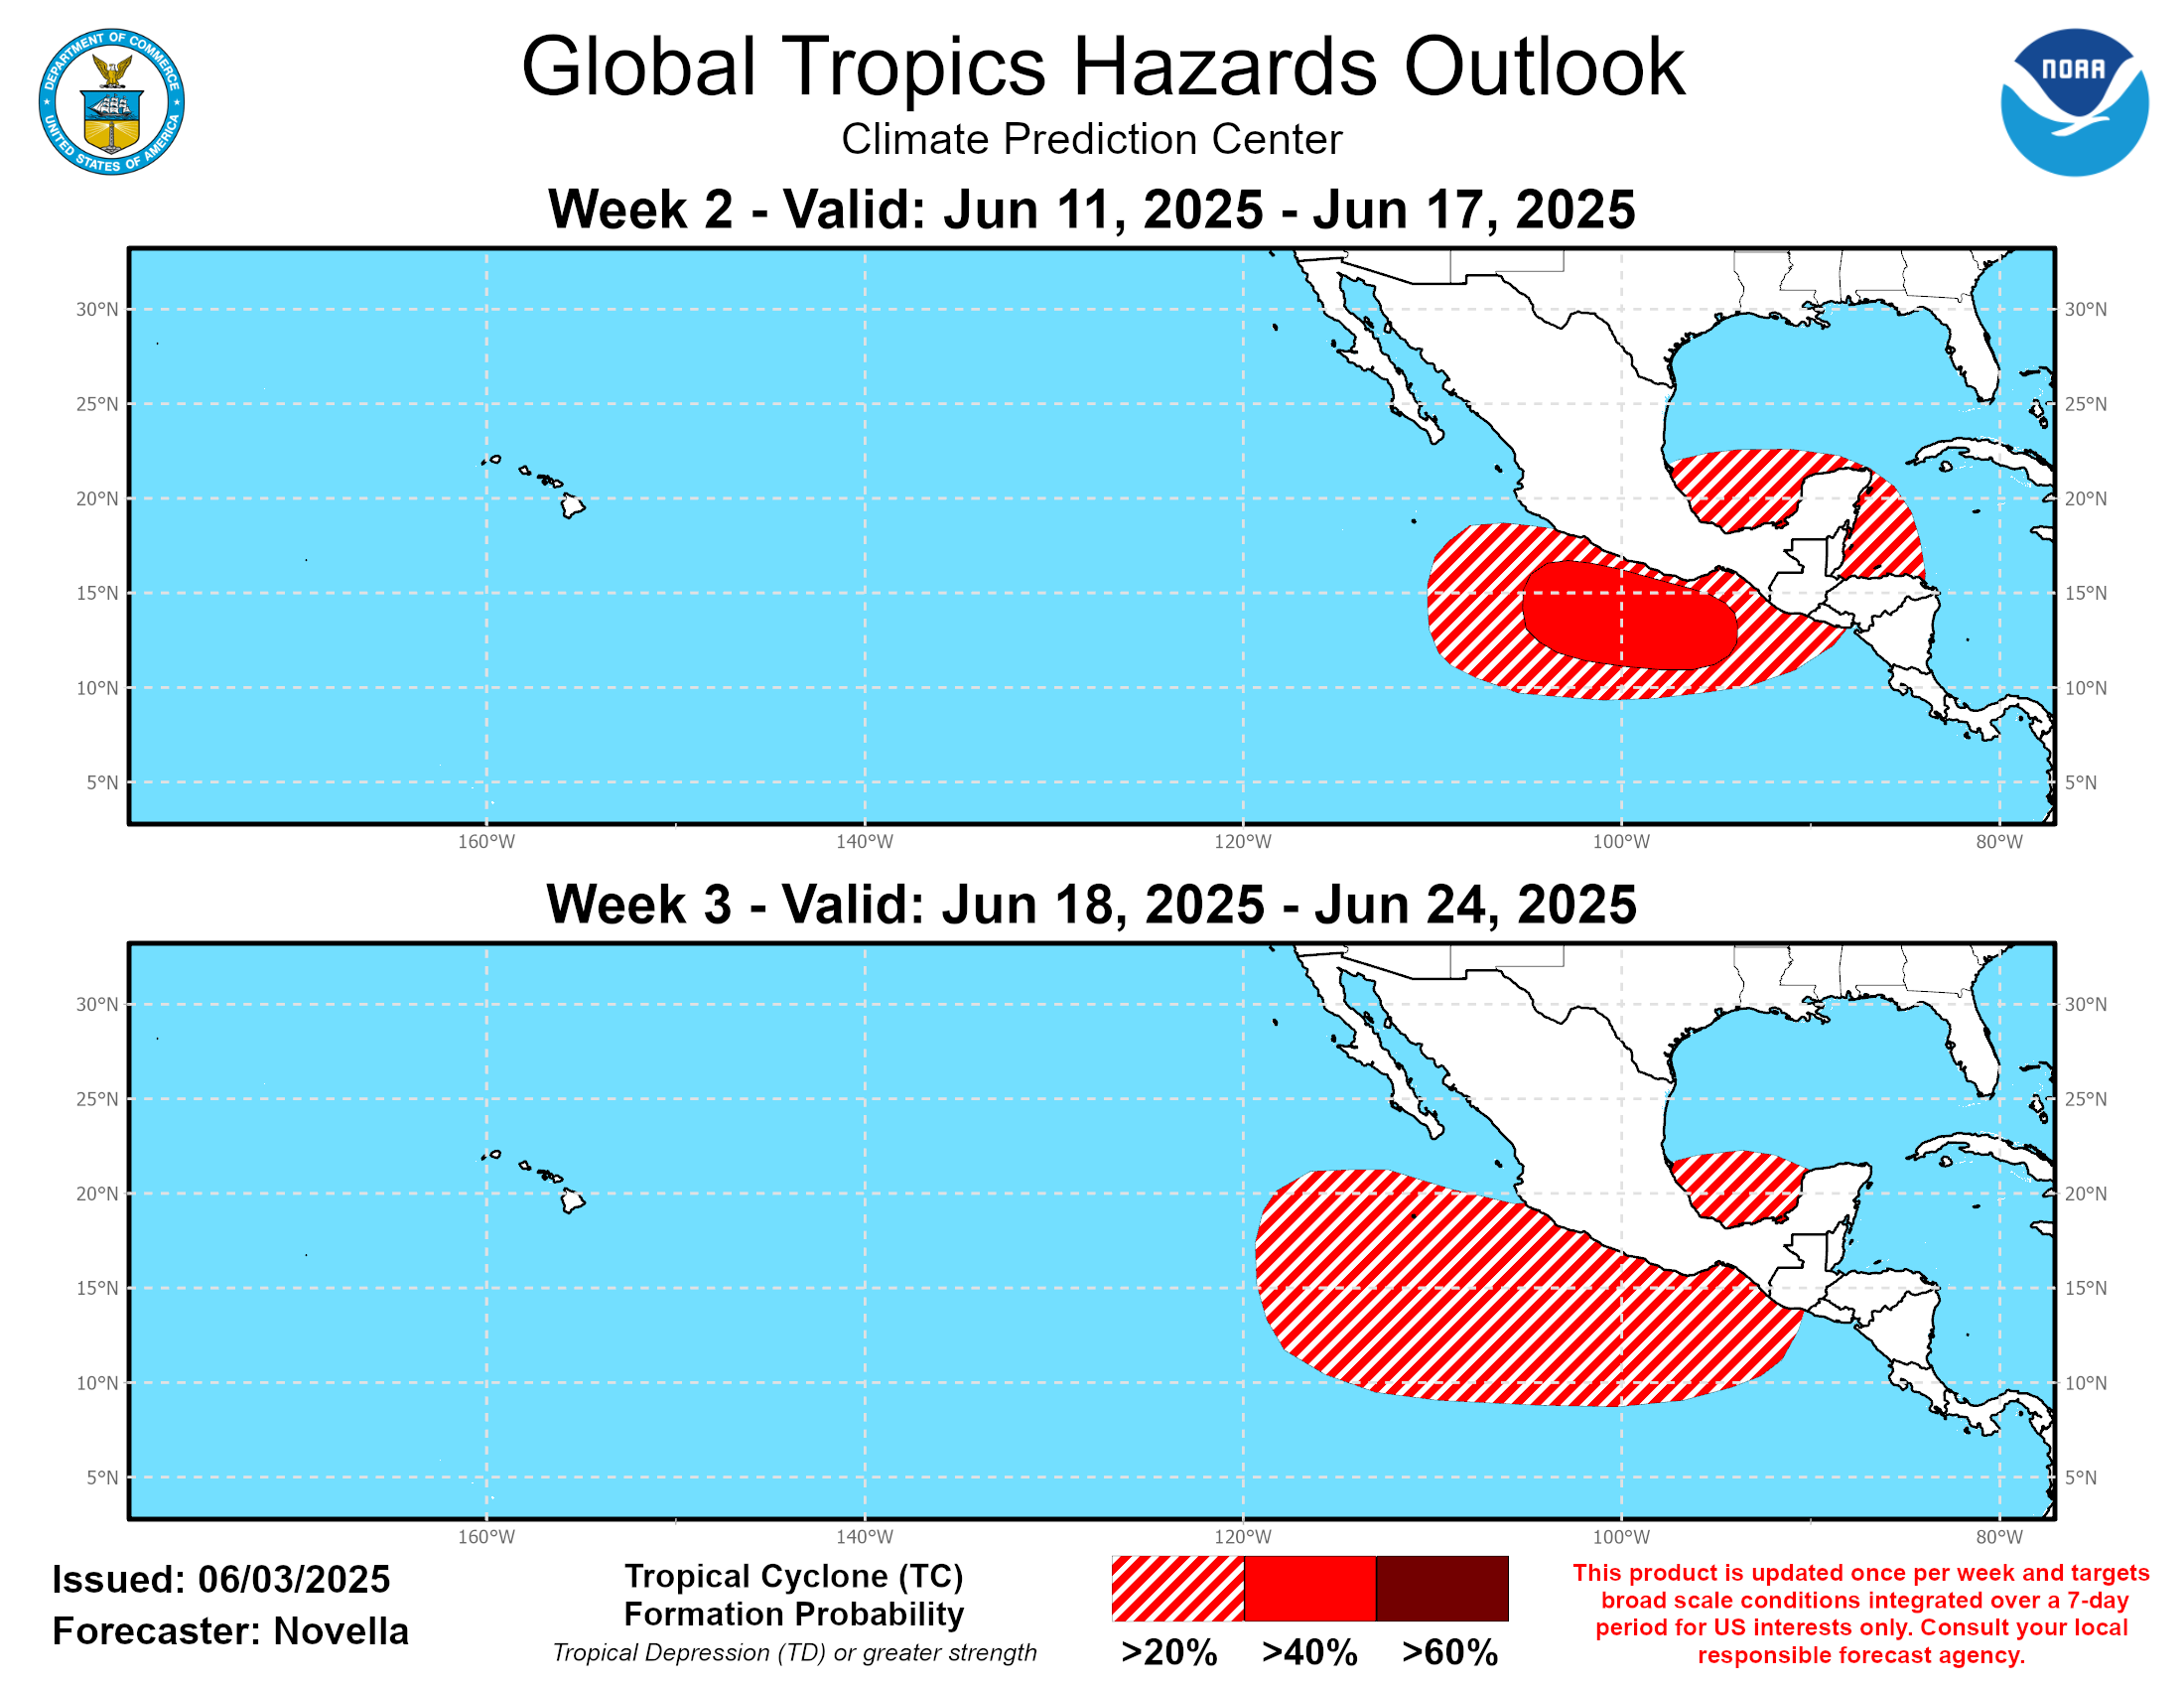
NHC Outlook
2 Day Outlook

7 Day Outlook

Active Tropical Cyclones (PTC and higher)

Experimental/Academic Tropical Resources
- Tropical Tidbits Aircraft Reconnaissance
- NOAA STAR Aircraft Reconnaissance
- Tomer Burg’s TroPYCal
- CyclonicWX
- Brian Tang’s Tropical Trends
- NCEP Hurricane Model Archive
- Historical Hurricane Tracks
- Google DeepMind Hurricane AI Public Preview
- Morphed Integrated Microwave Imagery at CIMSS (MIMIC-TC)
- Colorado State Current Season ACE
- NHC Current/Historical Hurricane Seasons and TC Reports

0-168 hr

0-48 hr

0-120 hr


0-120hr Verification This Season

NOTE: These statistics ignore completely the current intensity or motion of the storm
and are based solely on a climatology based on the current position. They are prone to large forecast error.
Users should use only official forecasts for decisions, such as those provided by NHC, JTWC, and CHC.
California


500mb Vorticity
Shear Support
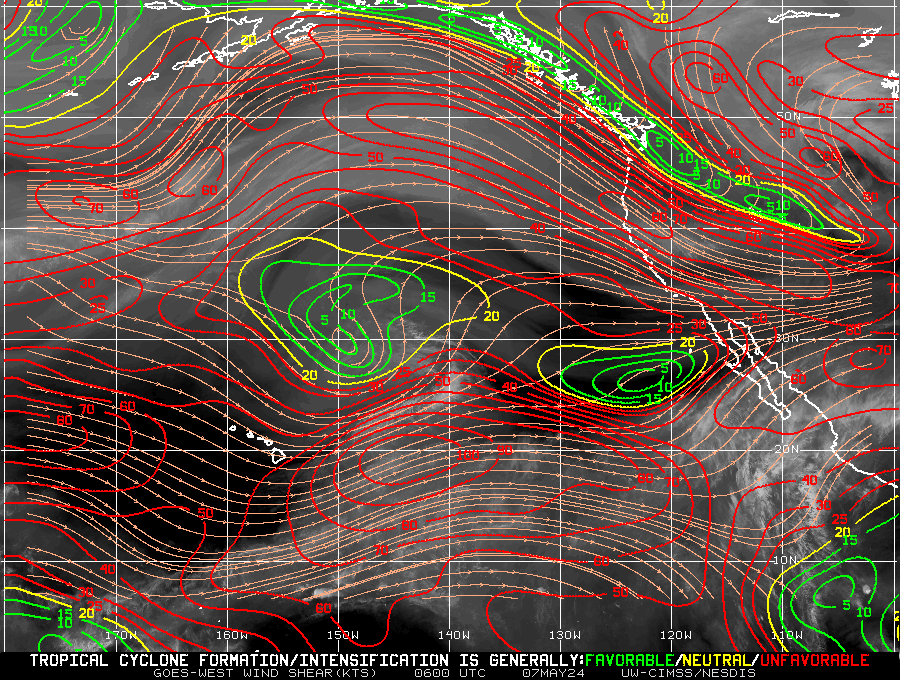
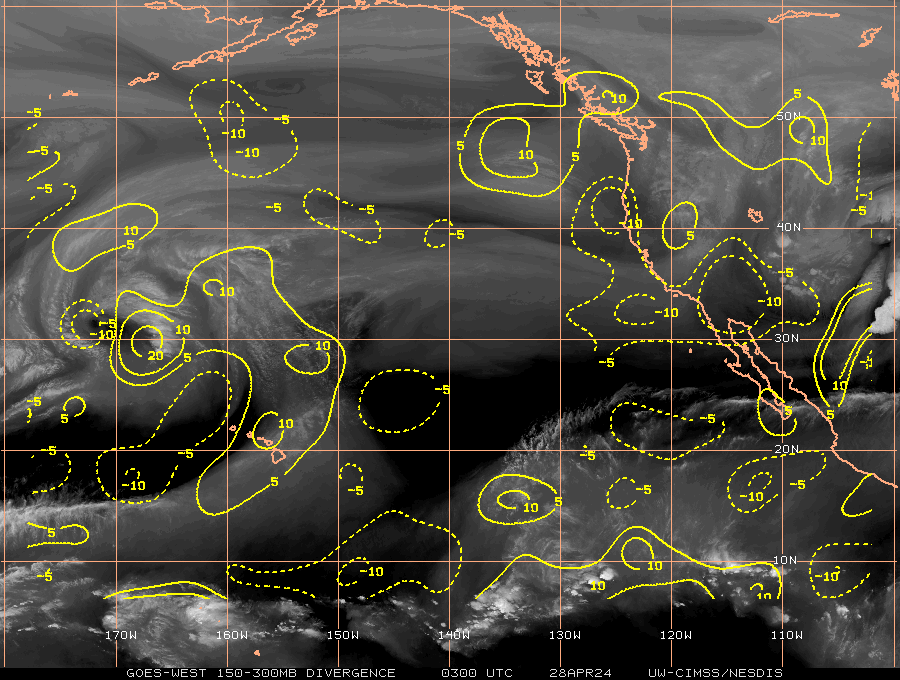
Divergence & Convergence
Generalized Shear


Vertical Instability


Mid Atmospheric Winds